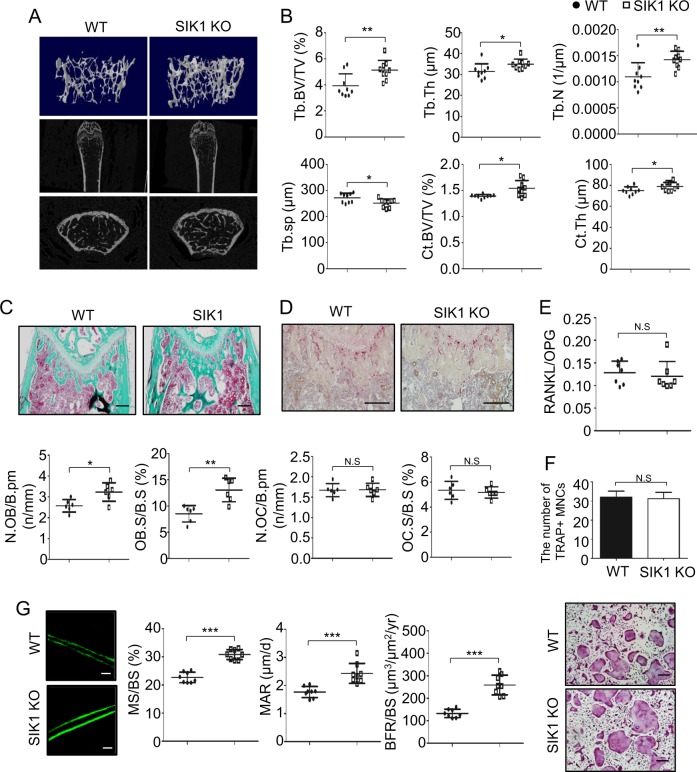
Fig. 6. SIK1 deficiency increases bone formation in vivo.
a, b Femurs of 10-week-old SIK1 KO and littermate WT female mice were analyzed by μCT (n = 9 per group). Three-dimensional images of trabecular bone reconstructed with Skyscan CTvol software (upper), and two-dimensional sagittal (middle) and transaxial (bottom) images produced with the DataViewer software are shown a. Trabecular and cortical bone parameters obtained by μCT analyses are presented. Trabecular bone parameters; trabecular bone volume/total volume (Tb.BV/TV), trabecular thickness (Tb.Th), trabecular number (Tb.N), and separation (Tb.sp), and cortical bone parameters; cortical BV/TV (Ct.BV/TV) and cortical thickness (Ct.Th) (b). c, d Decalcified femur sections were stained with Goldner’s trichrome c and for TRAP d. Stained sections were analyzed with Osteomeasure software to obtain indices of osteoblast number per bone perimeter (N.OB/B.pm), osteoblast surface per bone surface (OB.S/B.S), osteoclast number per bone perimeter (N.OC/B.Pm), and osteoclast surface per bone surface (OC.S/BS). e Serum RANKL and OPG were assessed with ELISA kits. f BMMs from WT or SIK1 KO mice were cultured with M-CSF (30 ng/mL) and RANKL (150 ng/mL). After four days, cells were stained for TRAP and TRAP-positive multinuclear cells were counted. g WT and SIK1 KO mice were injected with calcein as described in Materials and Methods. Femurs without decalcification were embedded in resin. Representative fluorescence images of sectioned slices are shown. Mineralized surface per bone surface (MS/BS), mineral apposition rate (MAR), and bone formation rate per bone surface (BFR/BS) parameters were analyzed with the Osteomeasure software. ***p < 0.001; **p < 0.01; *p < 0.05. N.S., not significant. t-test. Scale bars, 200 μm c, d or 20 μm g

