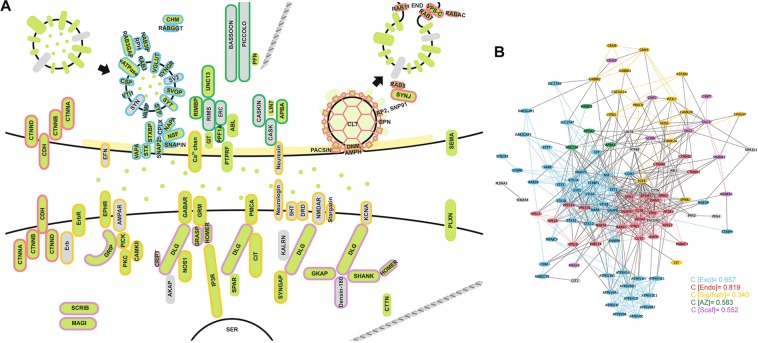
Figure 1.
The synapse and its core submodules. (A) A diagram of the bilaterian synapse, signal transmitting and receiving cells, top and bottom respectively. Synaptic genes present in Amphimedon queenslandica are shaded green; genes not present are grey. Gene products are clustered into synaptic functions (submodules) and outlined by colour: exocytosis, blue; endocytosis, red; cell surface signals and receptors, yellow; active zone, dark green; and post-synaptic scaffolding, purple; gene products not outlined do not comprise these five submodules. (B) Evidence-based interactome for the human synaptome based on a non-redundant merging of BioGrid, STRING and APID databases. Genes (nodes) and associated interactions (edges/connecting lines) falling under the five core synaptic submodules are coded with the same color scheme as in (A). Clustering coefficients (C) for these submodules are shown.

