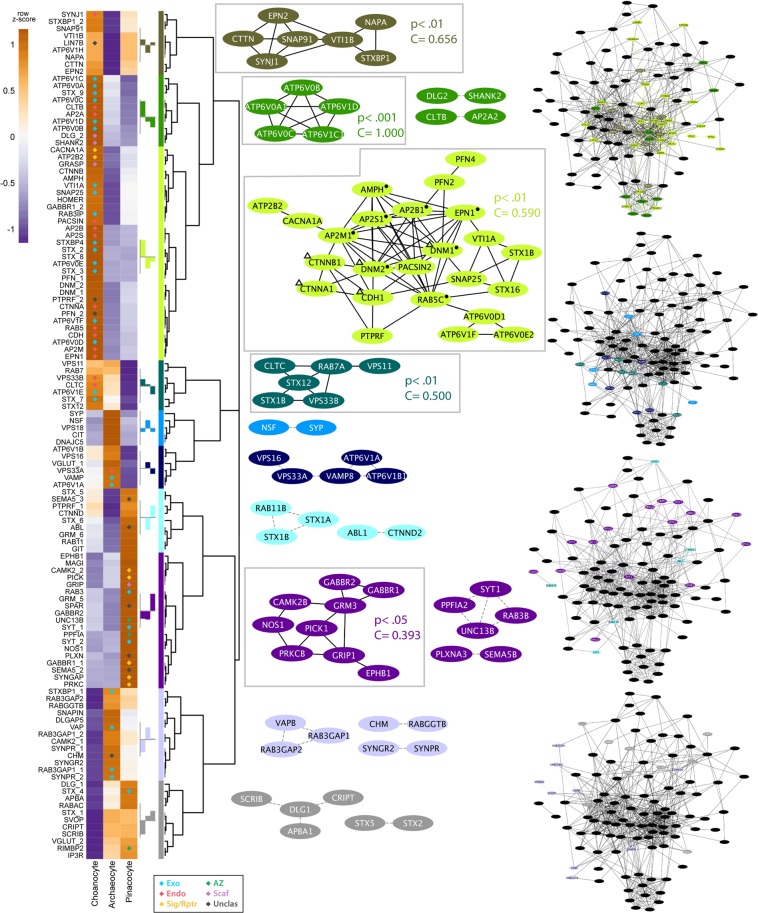
Figure 3.
Cell type expression of synaptic genes in Amphimedon queenslandica. Heatmap to the left shows synaptic gene expression profiles across three adult cell types, with diamonds indicating statistically significant (p < 0.05) gene upregulation in corresponding cell type; colour-coding of the diamonds is in relation to synaptic function as per Fig. 1 – blue, exocytosis; red, endocytosis; yellow, cell surface signals and receptors; dark green, active zone; purple, post-synaptic scaffolding. Z-scores reflect expression levels (variance stablising transformed (vst) counts), scaled by rows. Genes are divided into ten clades (colour-codes) based on expression profile similarities. The consensus expression profile for each clade is shown to the left of the colour bar. For each clade, all inferred interactions are shown based on the human synaptome in Fig. 1B. Non-interacting nodes are not shown. Significant co-regulating modules supported by Monte Carlo analysis have black edges and are are shown with corresponding p-values and clustering coefficients (C); edges are otherwise grey dashed. To the right are the complete human synaptic interactome decorated with the genes from the four major clades (i.e. genes with co-localised expressions) grouped in the same synaptome. Symbols in the largest clade (lime) indicate genes mapped to the enriched pathways of Endocytosis (●) and Bacterial invasion of epithelial cells (Δ). See Supplementary Table 1 for a complete list of mapped pathways.

