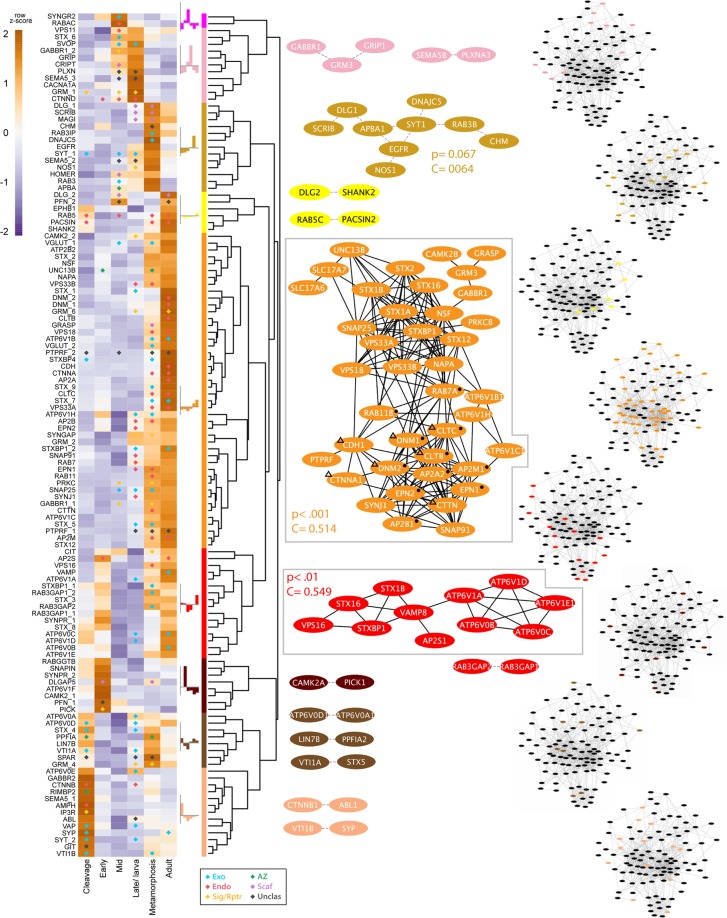
Figure 4.
Developmental expression of synaptic genes in Amphimedon queenslandica. Heatmap shows synaptic gene expression profiles over six developmental stages, with diamonds indicating statistically significant (p < 0.05) gene upregulation compared to the previous stage (except for cleavage stage, where upregulation is with respect to the early embryogenesis stage); colour-coding is in relation to synaptic function as per Fig. 1 - blue, exocytosis; red, endocytosis; yellow, cell surface signals and receptors; dark green, active zone; purple, post-synaptic scaffolding. The generation of dendrogram, colour modules, mapped pathways and clustering coefficients are as described in Fig. 3. Symbols in the largest clade (orange) indicate genes mapped to the enriched pathways of Endocytosis (●) and Bacterial invasion of epithelial cells (Δ). See Supplementary Table 1 for a complete list of mapped pathways.

