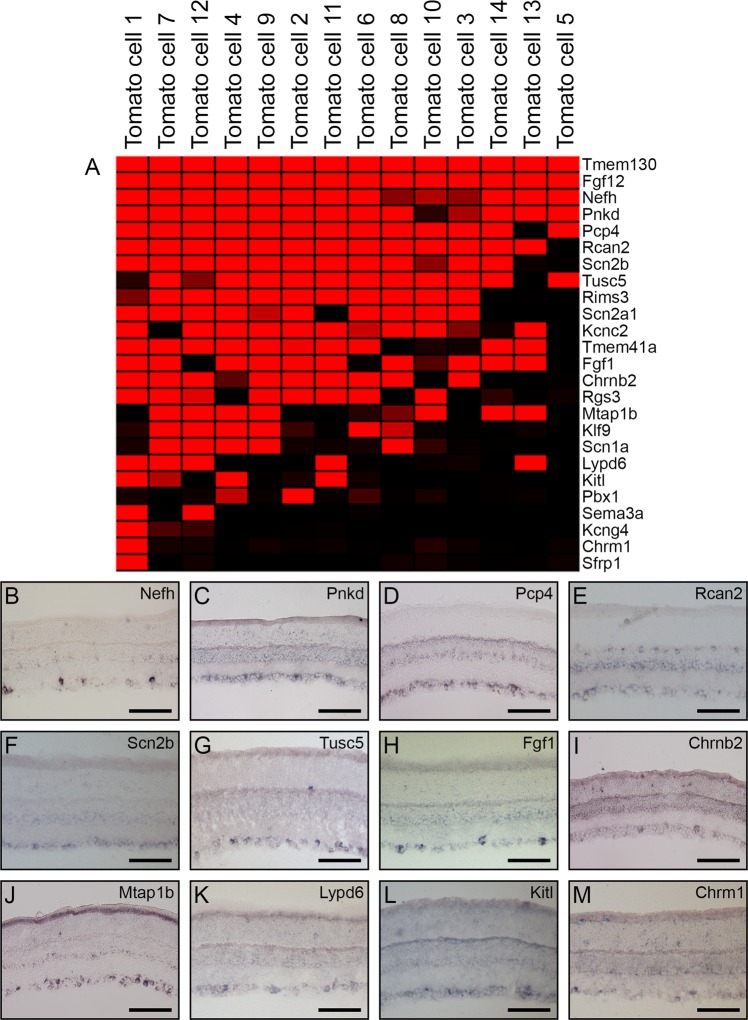
Figure 1.
Retinal ganglion cell subset markers revealed through transcriptome profiling of tdTomato+ cells. Fourteen tdTomato+ cells were hybridized to Affymetrix microarrays and the resulting data was extracted and normalized by MAS5 software. The genes expressed in these cells were visualized on a heatmap created with Genesis software75, where red signal indicates high expression of the gene in a particular cell, and black signal indicates the absence of expression. Subset genes were identified based on their expression in the majority of the tdTomato+ cells (A) and were examined through in situ hybridization (B–M). Those examined include: Nefh (B), Pnkd (C), Pcp4 (D), Rcan2 (E), Scn2b (F), Tusc5 (G), Fgf1 (H), Chrn2b (I), Mtap1b (J), Lypd6 (K), Kitl (L), and Chrm1 (M). Scale bars represent 100 µm.

