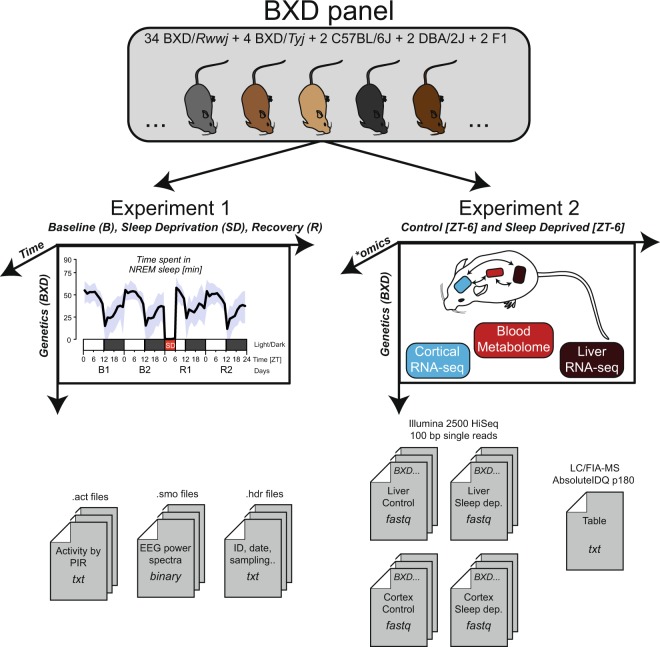
Fig. 1.
Data generation. The behavioral/EEG end-phenotypes of the BXD mouse panel were quantified in Experiment 1. Mice were recorded for 4 days: 2 days of baseline (B1 & B2), followed by 6 h of sleep deprivation (SD) and 2 days of recovery (R1 & R2). EEG spectral composition was written in .smo files, activity in .act files and meta-data in .hdr files. Blood metabolomics, liver transcriptomics and cortical transcriptomics were quantified in Experiment 2. ‘Control’ and ‘Sleep deprived’ batches were sampled at a single time point: ZT6 (i.e. directly after sleep deprivation for the ‘sleep deprived’ batch). Transcriptomics was performed on pooled sampled per BXD strains. For blood metabolomics, metabolite quantification was performed for each BXD replicates. Adapted from2.

