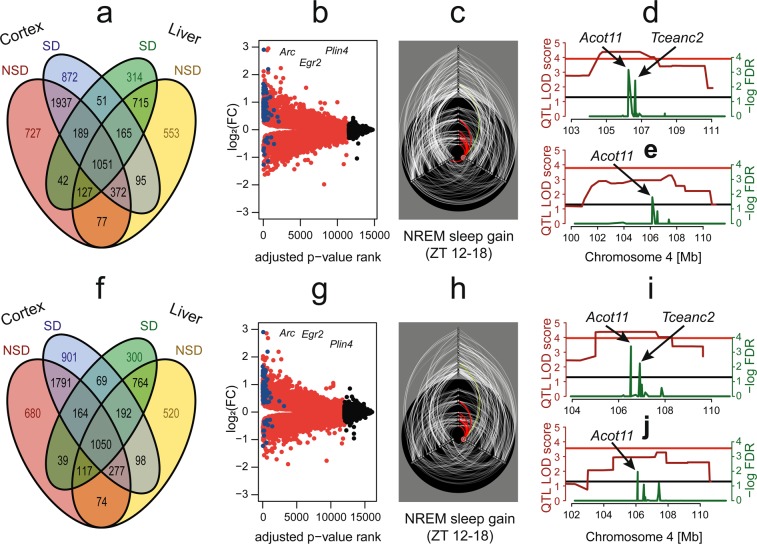
Fig. 5.
Robustness of the analysis pipeline. (a to e) Technical reanalysis with mm9 reference genome. (f to j) Reanalysis with mm10 reference genome. (a and f) Venn diagram of significant cis-eQTL. (b and g) Volcano plot of differential gene expression in cortex. (c and h): Hiveplot for NREM sleep gain during recovery with highlight on Acot11. (d,e,i,j) Gene prioritization for NREM sleep gain during recovery (d and i) or phosphatidylcholine acyl-alkyl C38:2 levels (e and j). recovery = first 6 hours of dark period after sleep deprivation (ZT 12–18), SD = sleep deprivation, NSD = not sleep deprivation (control), FC = fold-change, NREM = non-rapid eye movement, LOD = logarithm of odds, FDR = false discovery rate.

