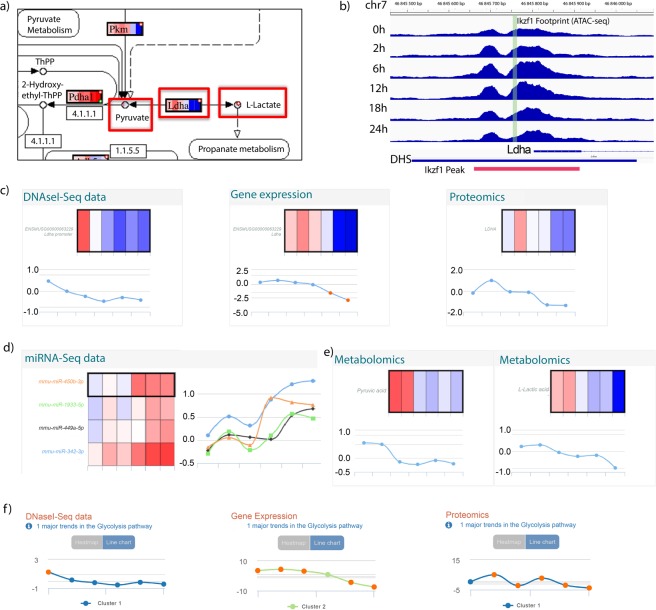
Fig. 7.
STATegra data for lactate dehydrogenase A. (a) LDHA reaction at glycolysis. (b) Promoter regions of the Ldha gene showing a DHS and IKZF1 footprint identified by DNase-seq. Only values for the Ikaros-induced time course are shown. In red, the IKZF1 ChIP-seq peak region. (c–e) Paintomics27 representation for Ldha data as heatmaps and line plots of log2FC values between Ikaros and Control. Data points correspond, from left to right, to 0, 2, 6, 12, 18 and 24 hours after Ikaros induction. At heatmaps, red indicates up-regulation and blue indicates down-regulation. (c) Ldha data for DNase-seq, RNA-seq, Proteomics. (d) Data for miRNA-seq where miRNA-Ldha target data was predicted by at least 5 algorithms in the mirWalk70 database. (e) STATegra log2FC values for pyruvate (left) and lactate (right). (f) Major Gene Expression, Proteomics, and DNase-seq trends for glycolysis pathway computed by Paintomics27.

