Figure 1.
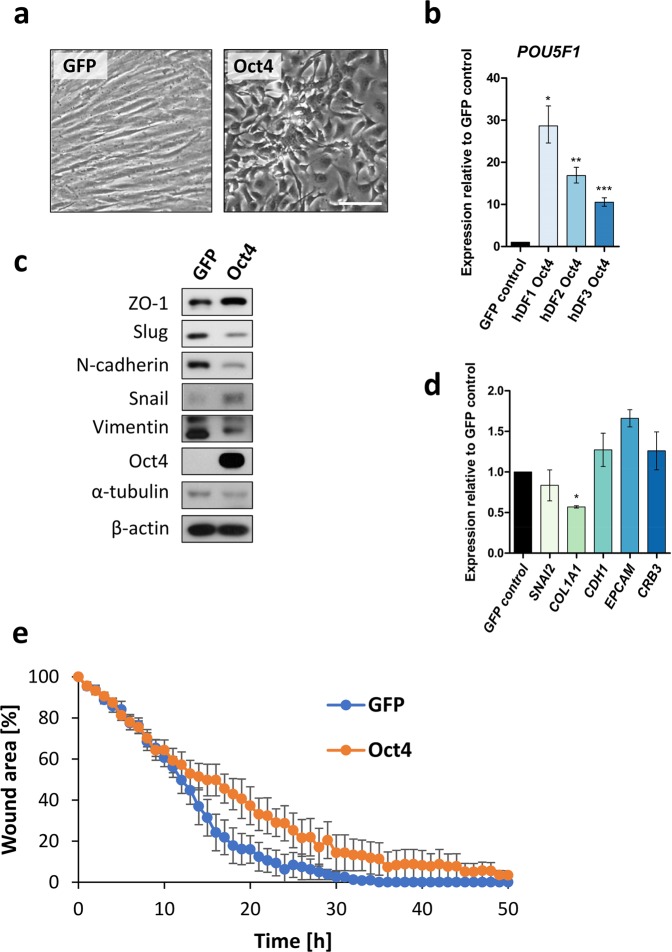
Characterisation of Oct4+ hDFs. (a) Morphology of control GFP+ hDFs and Oct4+ hDFs 6 days post transduction, as determined by light microscopy. Scale bar = 100 μm. (b) Analysis of POU5F1 expression in Oct4+ hFDs relative to GFP+ hDFs 6 days post transduction, as determined by RT-qPCR. Error bars represent ± SD. (c) Western blot analysis of mesenchymal/epithelial markers and Oct4 expression in control GFP+ hDFs and Oct4+ hDFs 6 days post transduction. α-tubulin and β-actin were used as a loading control. Uncropped western blot images are shown in Supplementary Fig. 2a. (d) Analysis of SNAI2, COL1A, CDH1, EPCAM, CRB3 expression in Oct4+ hFDs relative to GFP+ hDFs 6 days post transduction, as determined by RT-qPCR. Error bars represent ± SD. (e) Analysis of cell migration of Oct4+ and GFP+ hDFs, as determined by scratch-wound healing assay. The graph shows cell-free area during time upon making a straight scratch on tissue culture plate. Error bars show ± SE, n = 5.

