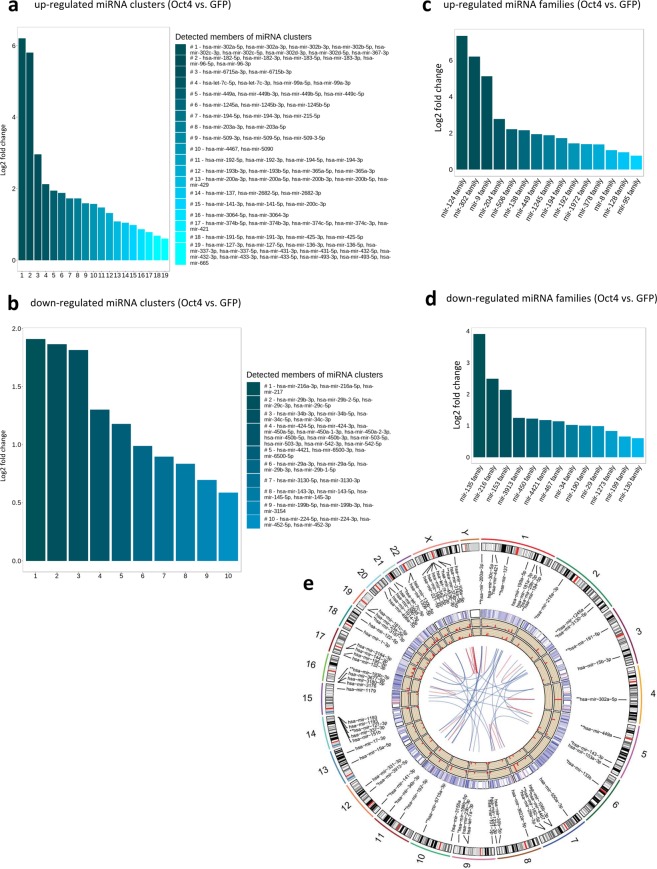
Figure 5.
miRNA clusters and families analysis. (a) Up-regulated and (b) down-regulated miRNA clusters in Oct4+ hDFs. (c) Up-regulated and (d) down-regulated miRNA families in Oct4+ hDFs. (e) The Circos plot showing genomic locations and expression of miRNA clusters in Oct4+ and GFP+ hDFs. The outer circle represents chromosome ideogram as the reference for the genomic localization of individual miRNAs and clusters. Names of miRNA clusters are represented by name of the first miRNA molecule in a particular cluster. Clusters significantly up-regulated in Oct4+ hDFs are marked with two asterisks (**), clusters significantly down-regulated in Oct4+ hDFs are marked with one asterisk (*), (p < 0.05, Fold change(log2) > 1.5). The expression level of individual miRNAs (heatmap), miRNA clusters in Oct4+, and miRNA clusters in GFP+ hDFs are shown in the external, middle, and inner circles, respectively. The lines in the centre area represent interconnections between miRNA clusters and families. Red lines represent miRNA clusters that are also families.

