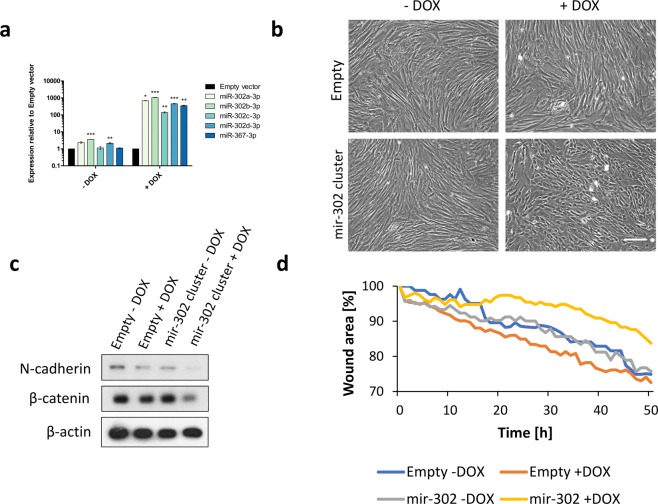
Figure 7.
(a) Expression of individual members of mir-302 cluster upon Doxycycline (DOX)-inducible mir-302 cluster over-expression in hDFs, as determined by RT-qPCR. (b) Morphology of hDFs upon over-expression of mir-302 cluster, as determined by light microscopy. Scale bar = 100 μm. (c) Western blot analysis of N-cadherin and β-catenin expression in hDFs over-expressing mir-302 cluster. β-actin was used as a loading control. Uncropped western blot images are shown in Supplementary Fig. 2b. (d) Analysis of cell migration of hDFs over-expressing mir-302 cluster, as determined by scratch-wound assay. The graph shows cell-free area during time upon making a straight scratch on tissue culture plate.

