Fig. 2.
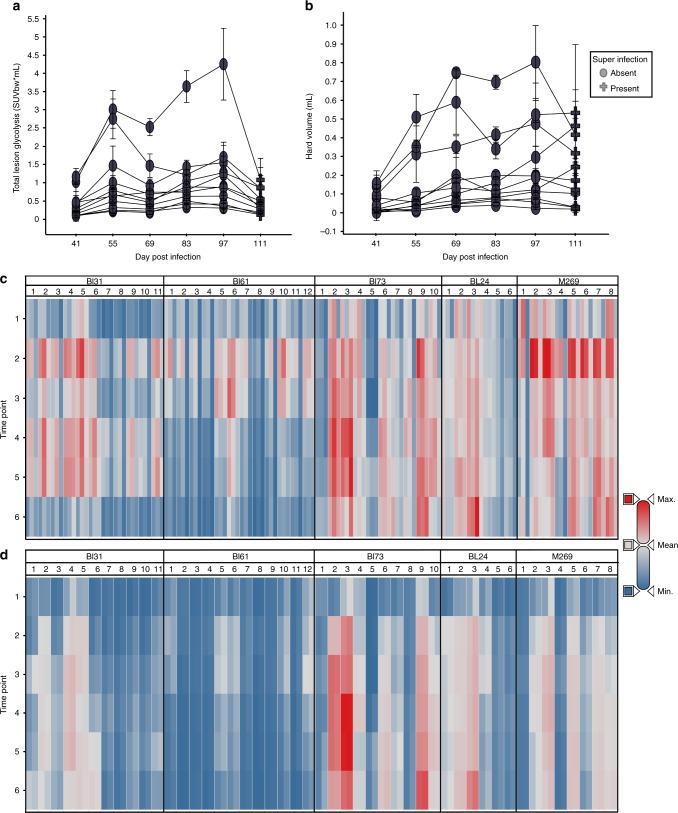
ND10885 treatment of M. tuberculosis infected marmosets. a Total lesion glycolysis within each individual lesion for a single animal. The timeline begins 41 days post-infection and treatment within this animal begins at Day 55. Most lesions appear to become less FDG avid within the first 2 weeks of treatment and then stabilize or progress for 2-month treatment period. In untreated animals all lesions would have continued to progress. Symbols represent the mean and error bars of the standard deviation of three independent readers. b Hard lesion volume (−100 HU to +200 HU) in most lesions the volume growth slows when treatment starts but it is maintained at the same level as the last pretreatment scan (Day 55). Symbols represent the mean and error bars the standard deviation of three independent readers. c Heat map of the lesion-level total PET data for all five animals that were treated with ND10885. Timepoint 2 is the equivalent of Day 55 in panels (a) and (b), the starting point of drug administration. Most lesions in these animals behave in the same way as those shown in panel (a), the total inflammation in each decreases from timepoint 2 to the end of therapy. For each lesion the three bars represent SUVmax, SUVmean and total lesion glycolysis. d The lesional volume change in each lesion for all animals across the same treatment period. Again similar to the pattern shown in panel (b) volume plateaus in most lesions at timepoint 3, 2 weeks after the initiation of treatment. For each lesion two bars are shown, the left bar indicates volume in the hard range (−100 to + 200 HU) while on the right the total lesion volume (from −500 to + 200 HU) is shown. Source data are provided as a Source Data file

