Fig. 6.
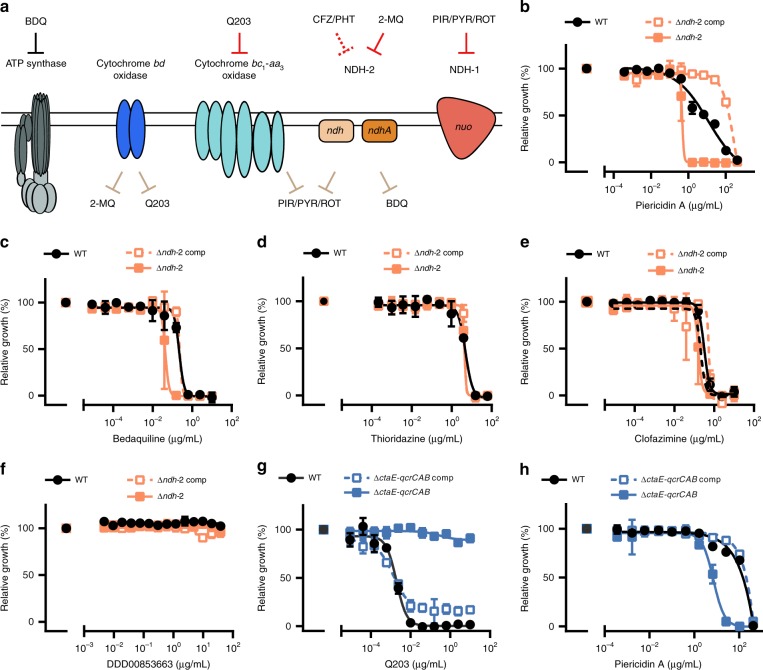
Chemical–genetic interactions. a Summary of chemical–genetic interactions. Red lines represent direct interactions that are consistent (solid red lines) or inconsistent (dotted red lines) with the chemical–genetic interactions defined in this study. Brown lines represent chemical–genetic interactions that have been defined in this study and are most likely indirect. Impact of piericidin A (b, h) bedaquiline (c) thioridazine (d), clofazimine (e), DDD00853663 (f), and Q203 (g) on growth. Data are averages of three cultures and represent at least two independent experiments. Error bars correspond to standard deviation. BDQ, bedaquiline; CFZ, clofazimine; PHT, phenothiazines; PIR, piericidin A; PYR, pyridaben; ROT, rotenone; 2-MQ, 2-mercapto-quinazolinones. “Comp” stands for complemented. Source data are provided as a Source Data file

