Figure 3.
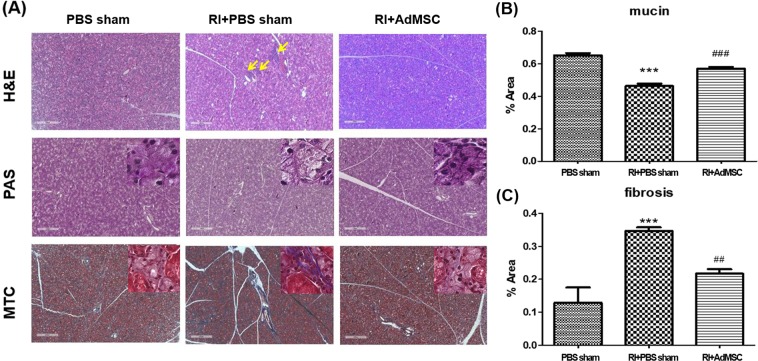
Histological analysis of salivary glands. (A) H & E staining revealed few acinar cells and destroyed the ductal structure in the RI + PBS sham group, but these were relatively well maintained in the RI + AdMSCs group (magnification power: x16, Scale bars = 500μm). Arrow represents the areas of inflammatory cell infiltration. (B) Mucin-containing acini appeared to be more numerous in the RI + AdMSCs group than in the RI + PBS sham group (C) Areas of periductal fibrosis were smaller in the RI+AdMSCs group than in the RI + PBS sham group. Results are presented as means ± SEMs. One-way ANOVA, Tukey’s post hoc multiple comparison test. (*compare to control; #compare to RI + PBS sham, ***p < 0.001, ##p < 0.01, ###p < 0.001). Abbreviation: AdMSC, adipose-derived mesenchymal stem cells; PBS, phosphate-buffered saline; RI, radioiodine; H&E, Hematoxylin and eosin stain; PAS, Periodic Acid Schiff; MTC, Masson’s trichrome stain.

