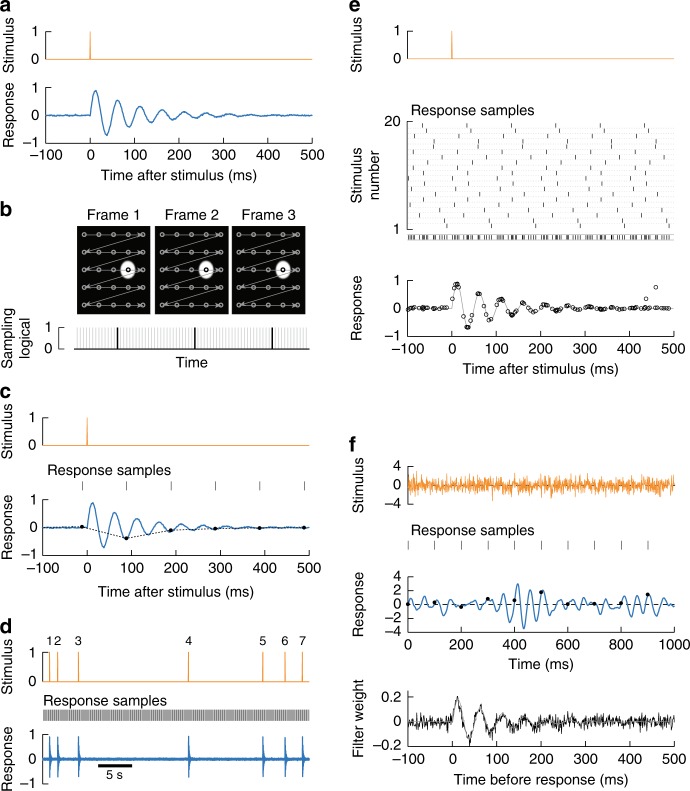
Fig. 1.
Precise responses from infrequent imaging measurements. a We simulated a neuron that can be stimulated with an impulse (top) and responds with damped oscillations at 20 Hz. b During the acquisition of many images, voxels are acquired serially, represented by the circles connected by arrows (top). Our simulated neuron, represented by the white circle, was only measured during a small fraction of the total frame acquisition. The black lines represent the sampling times of the neuron; gray lines represent all other samples in the image (bottom). The width of the black lines represents the voxel integration time, while the interval between them represents the frame duration. c Measurement of the response with infrequent sampling. When using an imaging scheme as in b, measurements of a single impulse (top) sample the response every 100 ms (middle). While the full response contains oscillations (bottom, blue), the sampled response shows no oscillations (circles), and interpolation cannot recover the true response (dashed line). d Sampled response measurements can be repeated across many stimulus impulses with random relative timing. e When many stimulus-response pairings are overlaid, the full, oscillating response may be recovered. Each individual stimulus is a very brief pulse (top). Each instance of the stimulus was aligned randomly with respect to the sampling intervals. Rasters show the sampling time of responses relative to each of 20 presentations of the stimulus, and the combination of all samples over all trials (middle). By overlaying each set of responses, without interpolating, the sampled responses (circles, bottom) reconstruct the true response (gray line). f The high-resolution impulse response may also be recovered when the stimulus is white noise, rather than impulses. Gaussian stimuli were presented to the same synthetic system as in b (top). The true response had a characteristic oscillation frequency (middle, blue), but infrequent sampling cannot resolve it finely (black circles). Using the precise timing of the samples, the cross-correlation between stimulus and response could be extracted with temporal super-resolution (bottom, black line), matching the true filter (gray line)

