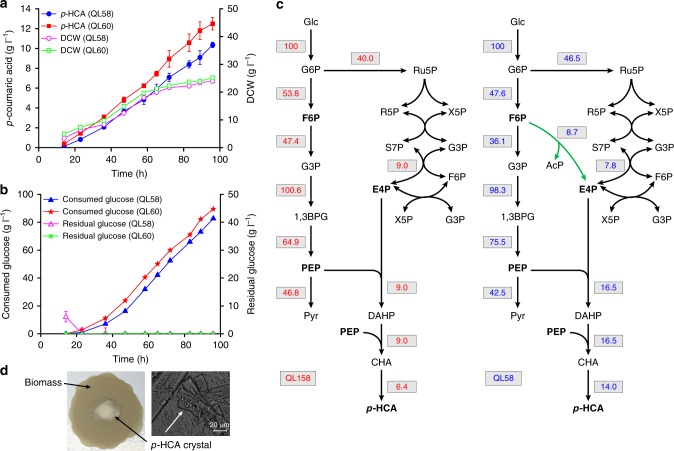
Fig. 6.
High-level production of p-HCA. a Fed-batch fermentation of strain QL58 and the corresponding diploid strain QL60 under glucose-limited conditions over time. p-HCA titer (filled symbols) and cell mass (open symbols) are shown for each strain. b Glucose consumption profile (filled symbols) and time course of residual glucose (open symbols) during the same fed-batch fermentation for each strain. All data represent the mean of n = 2 biologically independent samples and error bars show standard deviation. c Predicated metabolic flux distributions via flux balance analysis (FBA) in the engineered medium-level p-HCA producer QL158 (left, without carbon-rewiring strategy) and high-level p-HCA producer QL58 (right, with carbon-rewiring strategy). Based on FBA, the fluxes to the different products were represented relative to the uptake of 100 mmol of glucose. The PHK pathway, the nonnative E4P-forming biosynthetic pathway, is highlighted in green. 1,3BPG 1,3-biphosphoglycerate; see Fig. 1 legend regarding abbreviations of other metabolites. d Observed p-HCA crystals on filter membrane (left panel) and under a microscope (right panel, scale bar = 20 µm). Crystals of p-HCA were formed as a result of its high-level production and relatively low solubility in the fed-batch fermentation broth. The source data underlying figure a and b are provided in a Source Data file

