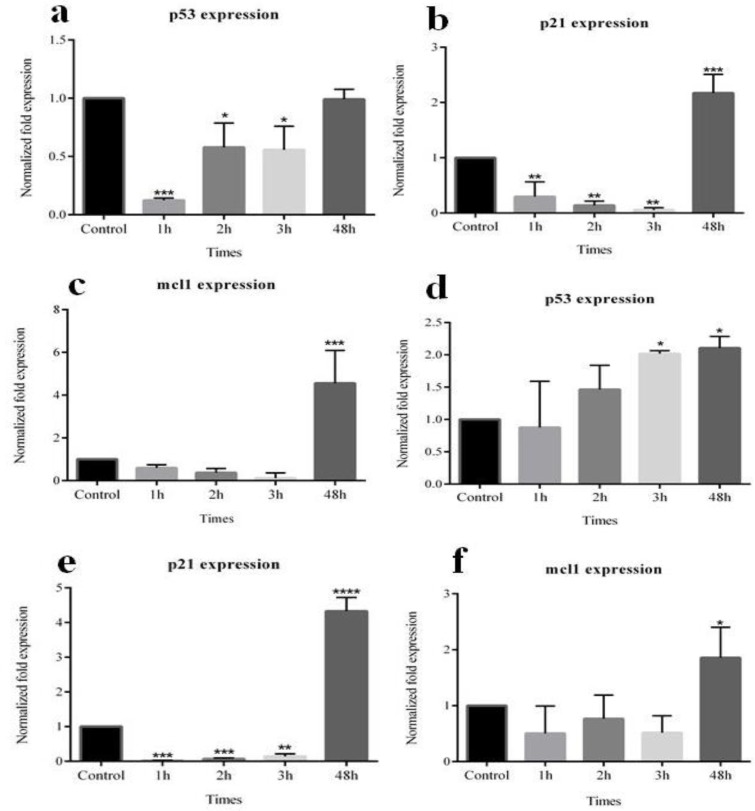
Figure 7.
The effects of CA and GA on gene expression pattern as assessed by real-time RT-PCR. Upon CA treatment, P53 (a), P21 (b), and Mcl-1 (c) and after GA treatment, P53 (d), P21 (e), Mcl-1 (f) of MCF-7 cells were significantly affected. Asterisk indicates significant difference in mRNA expression in comparison with untreated cells used as the control group. *p<0.05, **p<0.01, ***p<0.001, ****p<0.0001

