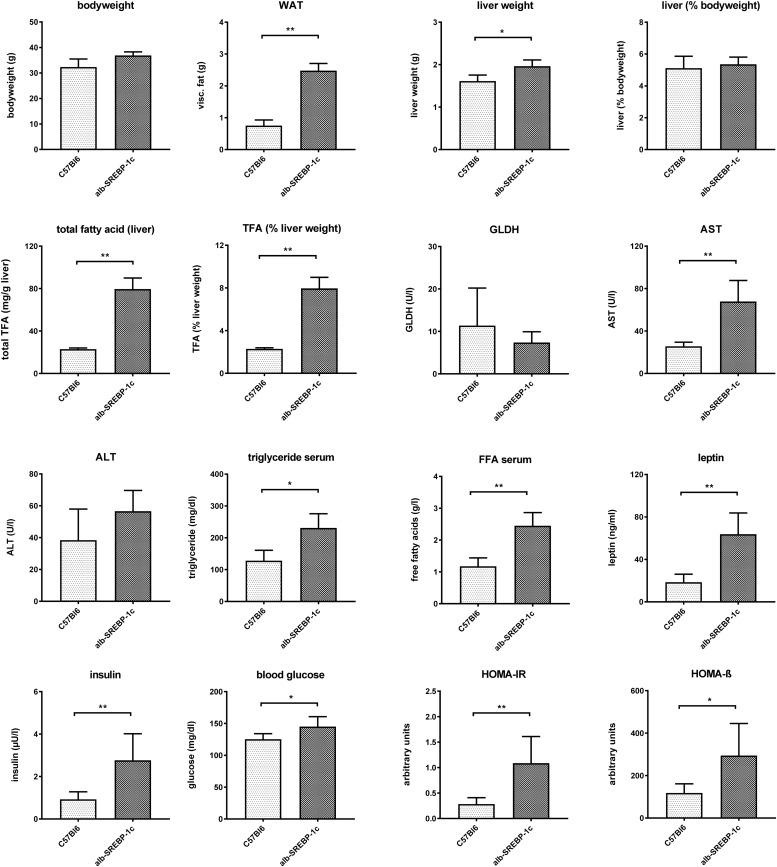
FIGURE 1.
Metabolic characterization of C57Bl6 and of alb-SREBP-1c mice at the age of 24 weeks used in the study. Data are expressed as mean ± SD (n = 8 of each phenotype). ∗p < 0.05, ∗∗p < 0.01, by Student’s t-test. Abbreviations: ALT, alanine transaminase; AST, aspartate transaminase; FFA, free fatty acids; GLDH, glutamate dehydrogenase; HOMA-IR, Homeostatic model assessment of insulin resistance; HOMA-ß Homeostatic model assessment of ß-cell function (%); TFA, total fatty acids; WAT, white adipose tissue.

