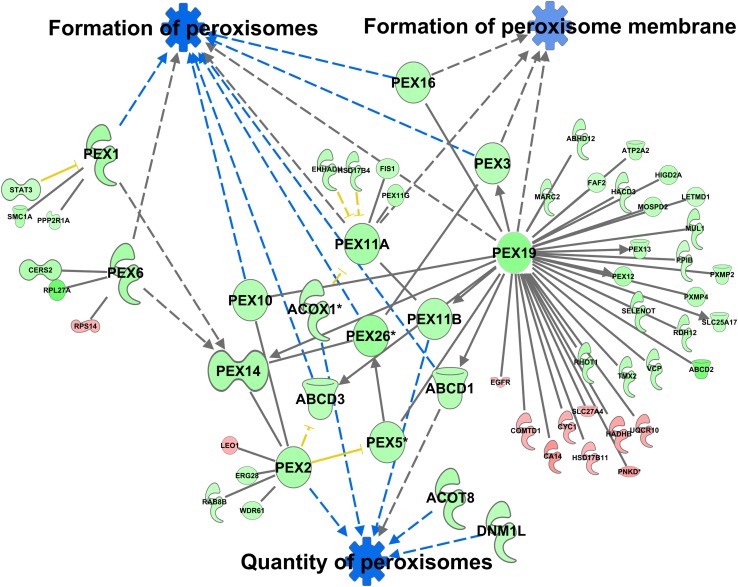
FIGURE 10.
Differential peroxisomal formation deduced from the peroxisomal proteome. Proteins with at least 1.5-fold difference in abundance identified in peroxisomal fractions of C57Bl6 mice and alb-SREBP-1c mice were subjected to IPA® Core analyses. Peroxisomal formation and associated proteins were identified as the downstream function with highest significance. The datasets of peroxisomal proteins enriched in either C57Bl6 or alb-SREBP-1c were screened for interacting proteins of the peroxisomal formation node. Color code, according to IPA® analyses, for molecules: green: overrepresented in alb-SREBP-1c (negative fold change in dataset); red: overrepresented in C57Bl6 (positive fold change in dataset), and for arrows: yellow: findings inconsistent with the state of the downstream molecule; blue: inhibition, consistent with the state of the downstream molecule. Solid arrows indicate a direct interaction, and dotted arrows an indirect interaction, of connected molecules. Molecules not in direct connection to the downstream functions are shown in reduced size.

