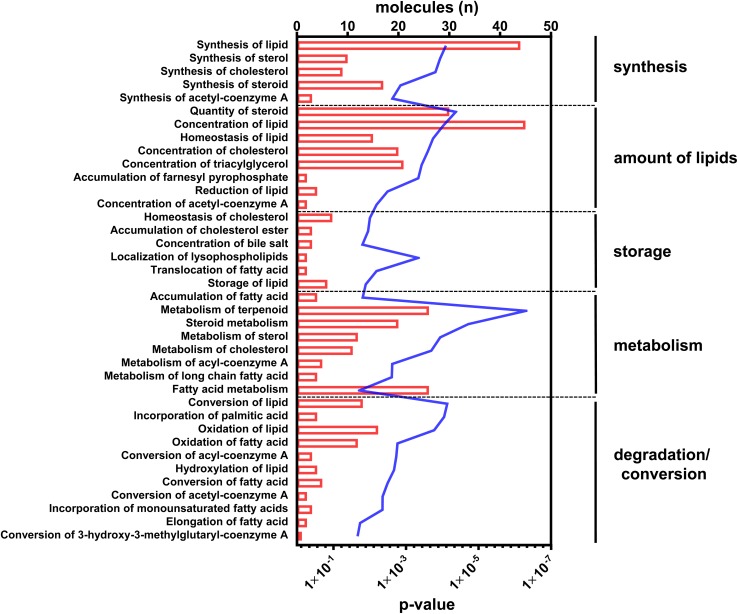
FIGURE 2.
Canonical pathways annotated to lipid metabolism. Differential abundant transcripts in the comparisons of C57Bl6 and alb-SREBP-1c mice were subjected to knowledge-based analyses using IPA®. The bars indicate the number of differential abundant transcripts in the dataset associated to the respective pathway. The line indicates the significance of overlap to the respective pathway by Log10 transformed p-value. Analyses including statistics were performed in IPA® using the Core expression analyses routine.

