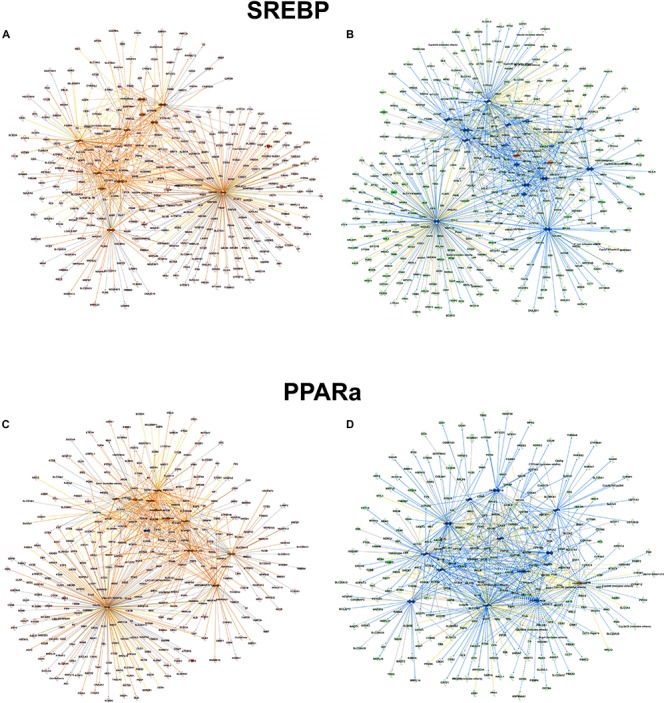
FIGURE 8.

Upstream regulator molecules in peroxisomal proteins. All proteins identified in the peroxisomal fraction of C57Bl6 mice and alb-SREBP-1c mice were separated, according to overrepresentation in the genotypes, and subjected to IPA® Core analyses. Upstream regulator molecule networks are shown for SREBP in C57Bl6 overrepresented proteins (A), or in alb-SREBP-1c overrepresented proteins (B) and for PPARa in C57Bl6 overrepresented proteins (C), or in alb-SREBP-1c overrepresented proteins (D). Hub molecules for SREBF1 in C57Bl6 mice were cholesterol, SCAP, Insulin, SREBF2, PPARG, PPARA, HIF1A, FOXO1, PPARGC1A, TP53, and RXRA. Hub proteins/molecules for SREBF1 in alb-SREBP-1c mice were SCAP, cholesterol, fatty acid, Ins1, PPARD, NR1H3, PPARG, PPARA, NR0B2, CEBPB, RXRA, SREBF2, NR5A2, NFE2L2, TP53, and PPARGC1A. Hub proteins/molecules for PPARA in C57Bl6 mice were bezafibrate, pirinixic acid, fenofibrate, NR1H4, PPARG, PPARD, NRIP1, RXRA, FOXO1, SREBF1, TP53, PPARGC1A, and NCOA2. Hub proteins/molecules for PPARA in alb-SREBP-1c mice were ciprofibrate, fenofibrate, pirinixic acid, NR1H4, PPARG, PPARD, MED1, NCOA2, NR1H3, FOXO1, RXRA, SREBF1, NR1I3, THRB, and PPARGC1A. Color code, according to IPA® analyses, for molecules: green: overrepresented in alb-SREBP-1c (negative fold change in dataset); red: overrepresented in C57Bl6 (positive fold change in dataset), and for arrows: yellow: findings inconsistent with the state of the downstream molecule; blue: inhibition, consistent with the state of the downstream molecule; orange: increase, consistent with the state of the downstream molecule. Solid arrows indicate a direct interaction, and dotted arrows an indirect interaction, of connected molecules.
