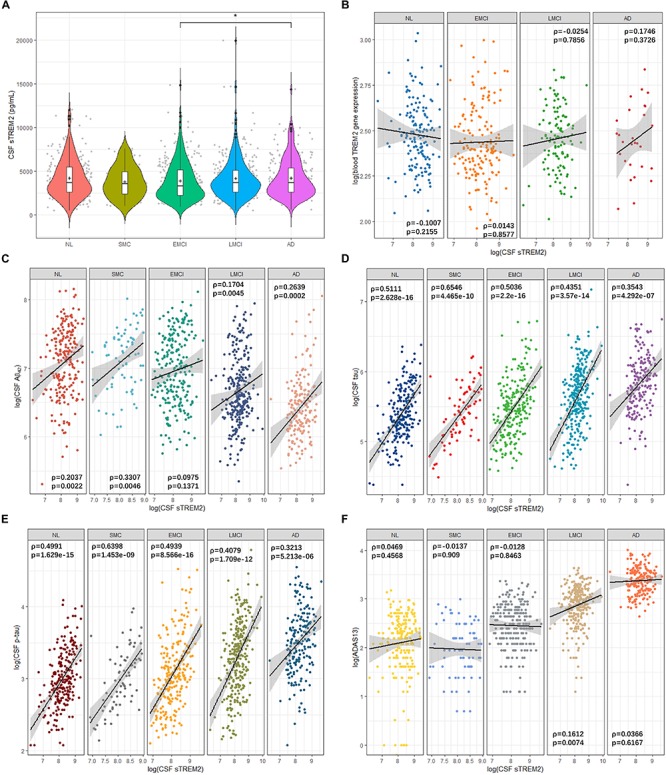
FIGURE 1.

Cerebrospinal fluid sTREM2 levels in the five clinical disease stages and the correlation between sTREM2 and other AD biomarkers. (A) Violin plots with boxplots for the comparison of CSF sTREM2 levels in disease states. Statistical significance was determined by Wilcoxon rank sum test. +: mean. ∗p < 0.05. The correlation plots between log transformed CSF sTREM2 and (B) log transformed TREM2 gene expression in blood samples, (C) log transformed CSF Aβ42, (D) log transformed CSF tau, (E) log transformed CSF p-tau, and (F) log transformed ADAS13 scores for each group. Black straight lines are the regression lines. Shaded areas around regression lines represent the pointwise 95% confidence intervals (CI). ρ: Spearman’s rank correlation coefficient (rho).
