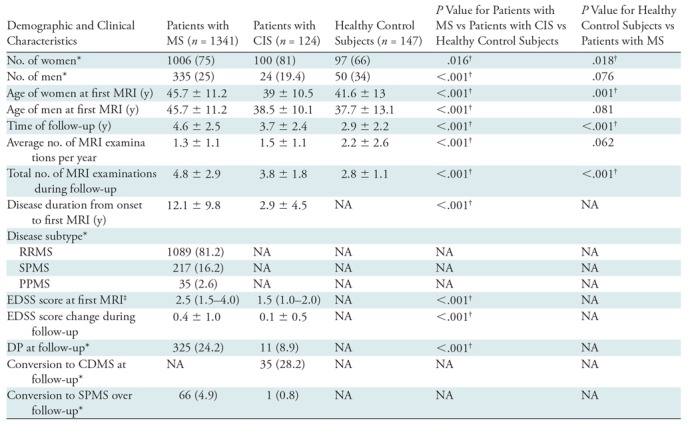
Table 1:
Demographic and Clinical Characteristics of Patients with MS, Patients with CIS, and Healthy Control Subjects

Note.—Unless otherwise indicated, data are mean ± standard deviation. P values were derived with the χ2 test, Student t test, or Mann-Whitney U test, as appropriate. CDMS = clinically definite MS, CIS = clinical isolated syndrome, DP = disease progression, EDSS = Expanded Disability Status Scale, MS = multiple sclerosis, NA = P value could not be obtained due to the healthy status of the control subject, PPMS = primary progressive MS, RRMS = relapsing-remitting MS, SPMS = secondary progressive MS.
* Data are numbers of participants, and data in parentheses are percentages.
† P value indicates a significant difference.
‡ Data are median and interquartile range.
