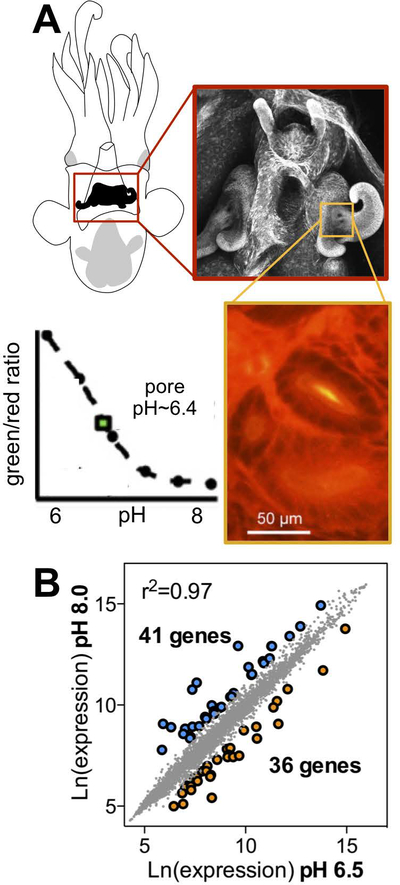
Figure 1.
V. fischeri differentially regulates many genes after exposure to marine or host-like pH. (A) Drawing (upper left) and confocal micrograph (red box) of the E. scolopes light organ. Orange box displays pH measurement of the region surrounding the light organ pore using the pH-sensitive dual-emission dye SNARF. Comparison of the emission ratio at green and red wavelengths gives a ratiometric measurement of tissue pH, relative to a calibration curve (inset graph). Plotting the tissue signal on the graph shows that the pore is a more acidic pH (yellow in the magnified image) than surrounding tissues. (B) Correlation between expression levels of V. fischeri transcripts after exposing cells to pH 8.0 or pH 6.5. Sets of genes were differentially expressed at high (blue) or low (orange) pH values.

