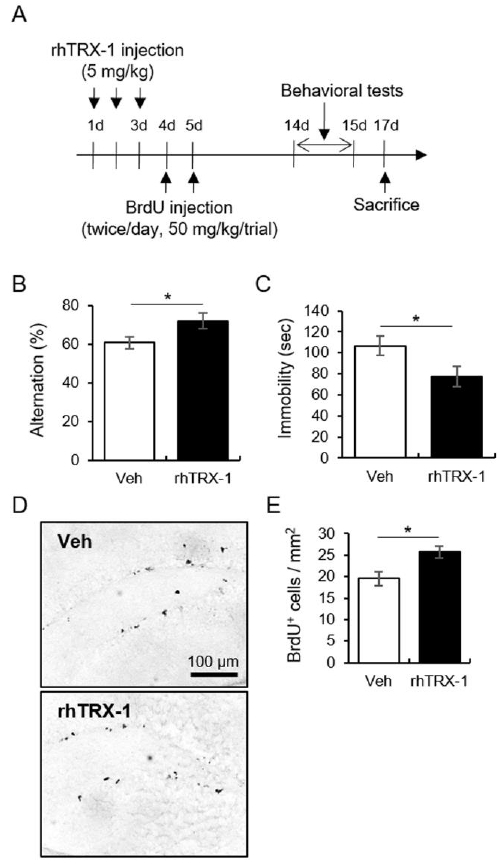
Figure 3. The neurogenic and anti-depressive effects of rhTRX-1. (A) The experimental procedure. (B) Quantitative analysis of alternation in the Y-maze test. (C) Quantitative analysis of immobility in the FST. (D) Representative images of BrdU-labeled cells. (E) Quantitative analysis of BrdU-labeled cells. Data are presented as the mean ± standard error of the mean. *p < 0.05.

