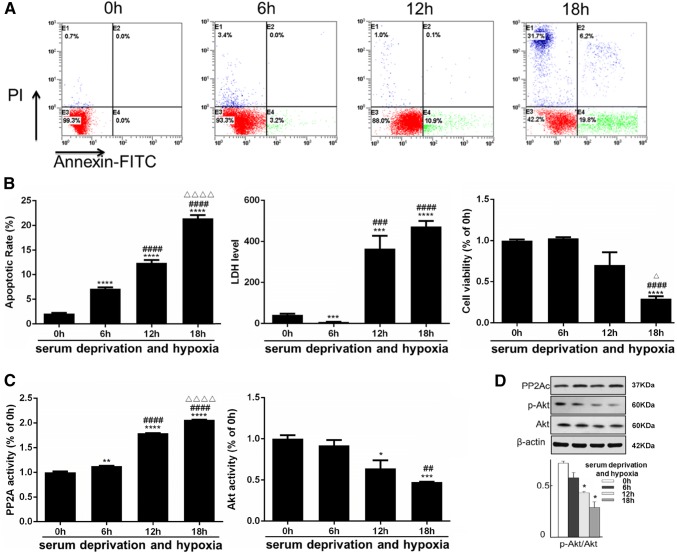
Fig. 3.
Increased apoptosis and impaired viability were observed together with PP2A activation and Akt inactivation in L02 cells cultivated with serum deprivation and hypoxia (simulating the ischemic and hypoxic conditions of hepatocytes in BD individuals). The measurements below were performed at 0, 6, 12 and 18 h exposure of serum deprivation and hypoxia. a Fluorescence-activated cell sorting (FACS) after Annexin V and PI double staining was used to detect the apoptosis rate. Representative FACS plots were shown with the right lower quadrant indicating apoptosis and the upper left quadrant indicating necrosis. b Left: quantitative analysis of the apoptotic rate. Middle: hepatocellular function reflected by lactate dehydrogenase (LDH) level; the unit: U/L. Right: cell viability measured with CCK8 assay. c The activities of PP2A and Akt were measured with the results normalized to the 2 h group. d The total amount and phosphorylation level at Ser473 of Akt together with total amount of PP2Ac were measured by western blots. Top: representative images of western blots. Bottom: Semi-quantitative analysis with β-actin as internal control. The results were normalized to the 2 h group. All data were expressed as the mean ± SEM. n ≥ 3 for each group in each measurement. *p < 0.05, **p < 0.01, ***p < 0.001 and ****p < 0.0001 versus the 0 h group; ##p < 0.01, ###p < 0.001, and ####p < 0.0001 versus the 6 h group; ∆p < 0.05, and ∆∆∆∆p < 0.0001 versus the 12 h group

