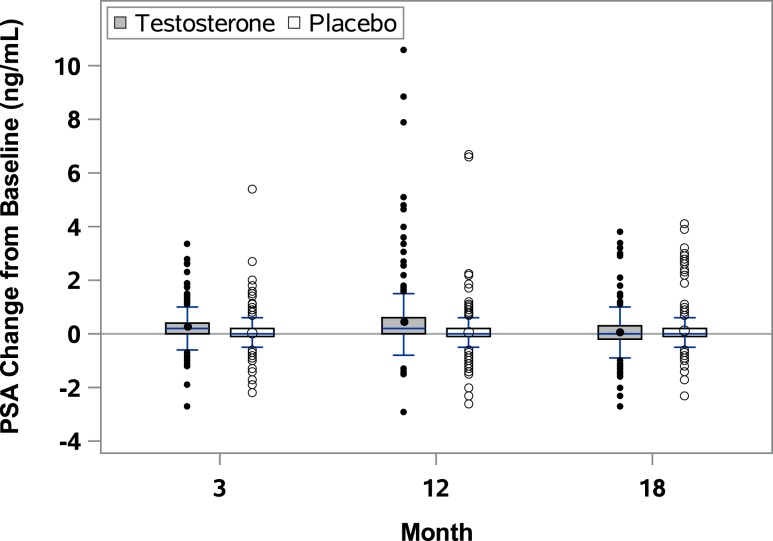
Figure 2.
Changes in PSA values during and after testosterone treatment. Boxes cover the interquartile ranges, and the horizontal lines inside the box are the medians. The short vertical lines indicate the 95th percentiles, and the circles outside the boxes are the values outside the 95th percentiles.

