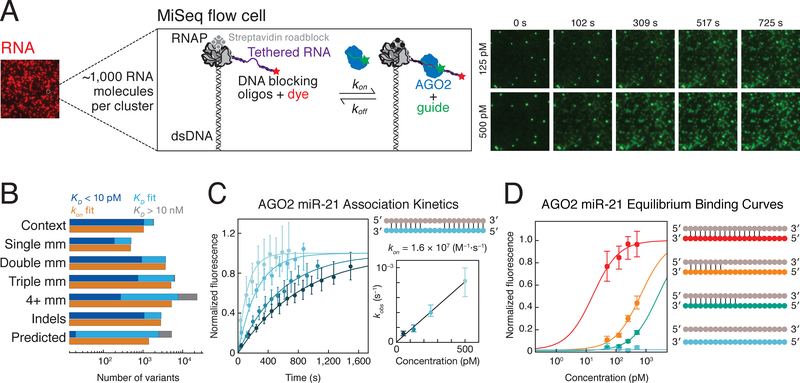
Figure 1. High-throughput Characterization of RISC Binding to in situ Transcribed RNA.
(A) Schematic of RISC binding to RNA targets in a sequenced flow cell.
(B) Summary of the let-7a target library. The number of targets in each class is indicated by the sum of targets with an affinity <10 pM (dark blue), affinities ranging between 10 pM and 10 nM (light blue), and targets with affinity > 10 nM (gray). The number of targets for which association was measured is shown in orange.
(C) A representative set of RISC association data for a single target. Error bars correspond to the 95% confidence interval on the median fluorescence. The plot to the right shows the relationship between RISC concentration and observed rate, from which the association rate was determined.
(D) Representative binding isotherms for four RISC targets (shown in corresponding color in schematic) containing different degrees of complementarity to the guide (in gray).
See also Figure S1.

