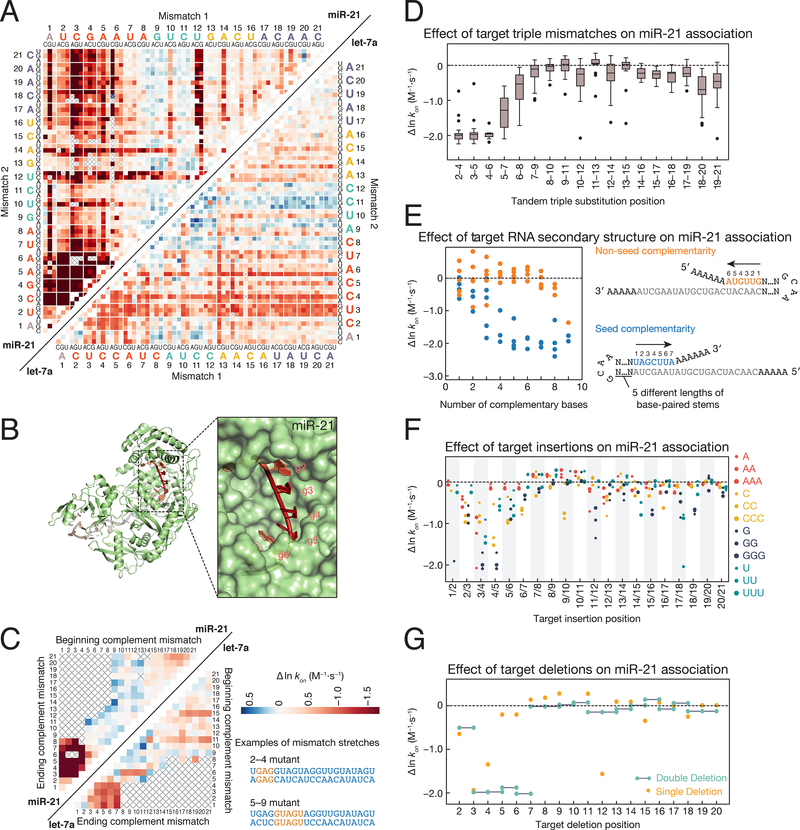
Figure 2. Sequence Determinants of AGO2 Association Kinetics.
(A) Association rates for miR-21 (upper left) and let-7a (lower right) loaded RISC binding to single and double mismatched targets. To find the rate corresponding to a particular double mismatch, identify the first mismatch on the horizontal axis, and the second mismatch on the vertical axis. The intersection indicates the double mismatched target. Axes are labeled with the 3′ end of the target (5′ end of the guide) starting at position 1. Gray crosses indicate missing data. Colors are centered on the association rate of the perfectly complementary (PC) target (white) with blue representing faster and red slower. Color bar is displayed in panel C.
(B) Association rates for tandem double mismatches mapped onto the AGO2 crystal structure (PDB ID: 4W5N).
(C) Association rates for miR-21 (upper left) and let-7a (lower right) targets containing stretches of complementary nucleotide mismatches (e.g., A to U). Examples are shown for mismatch stretches 2–4 and 5–9 on the right of the panel. For the 2–4 mismatches, the corresponding targets in the heatmap are located at the intersection of 2 on the ‘beginning complement mismatch’ axis and 4 on the ‘ending complement mismatch’ axis. Colors are scaled as in panel A.
(D) Change in association rates for tandem triple mismatches of miR-21 targets relative to a PC target (dotted line). Each boxplot includes the 27 triple substitutions for the three indicated target bases.
(E) Change in association rates for perfect complement miR-21 targets with increasingly long hairpins bound to either the seed (blue) or non-seed (orange) end of the target sequence relative to a PC target with no flanking complementarity (dotted line). For each length of complementarity to the target sequence, there are up to five corresponding stem loops of different lengths.
(F) Change in association rates for miR-21 targets containing 1–3 insertions of each base relative to a PC target (dotted line).
(G) Change in association rates for miR-21 targets containing single and double deletions relative to a PC target (dotted line).
See also Figure S2.

