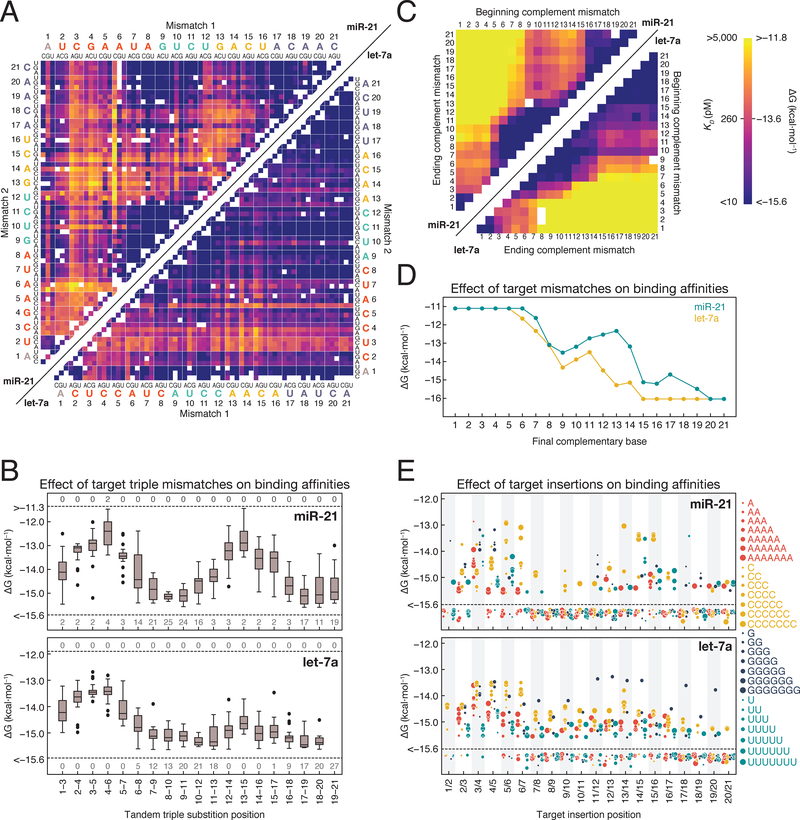
Figure 3. Target Sequence Contributions to AGO2 Binding Energies.
(A) Binding energies for miR-21 (upper left) and let-7a (lower right) loaded RISC binding to single and double mismatched targets. Axes are labeled with the 3′ end of the target (5′ end of the guide) starting at position 1. White boxes represent missing data. Color bar is displayed in panel C.
(B) Effect of tandem triple substitutions in the target sequence on miR-21 (top) and let-7a (bottom) binding affinity. Dashed lines indicate the limits of detection and the numbers above and below the line indicate the number of targets in each group that fell beyond those limits.
(C) Binding energies for miR-21 (upper left) and let-7a (lower right) targets containing different length stretches of complementary nucleotide mismatches (e.g., A to U).
(D) Binding affinities for targets containing progressively more complementarity to RISC.
(E) Binding affinities for RISC loaded with miR-21 (top) or let-7a (bottom) to targets with 1–7 nucleotides insertions. Dashed lines indicate the limits of detection and points below the line bound with higher affinity than the detection limit.
See also Figure S3.

