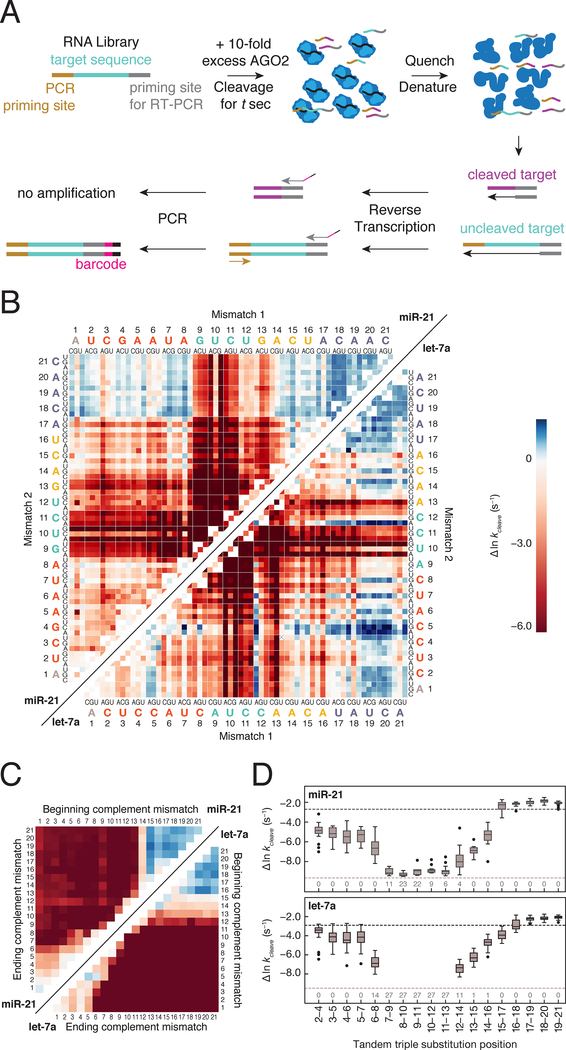
Figure 4. RISC Cleave ’n-Seq (CNS) Enables High-throughput Measurement of Single Turnover Cleavage Kinetics.
(A) Method to determine single turnover cleavage rates for RISC targets.
(B) Cleavage rates for miR-21 (upper left) and let-7a (lower right) targets with single and double substitutions. Deep red represents targets for which no detectable cleavage was observed. Targets colored in blue were cleaved faster than the fully complementary target.
(C) Cleavage rates of miR-21 (upper left) and let-7a (lower right) targets containing different length stretches of complementary nucleotide mismatches (e.g., A to U). Color bar as in (B).
(D) Cleavage rates for miR-21 (top) and let-7a (bottom) targets containing three consecutive substitutions. The black dotted line represents the cleavage rate of the fully complementary RNA target, whereas the gray dotted line indicates the cleavage rate detection limit. The numbers at the bottom of the plot represent the number of targets in each group for which no cleavage was observed.
See also Figure S4.

