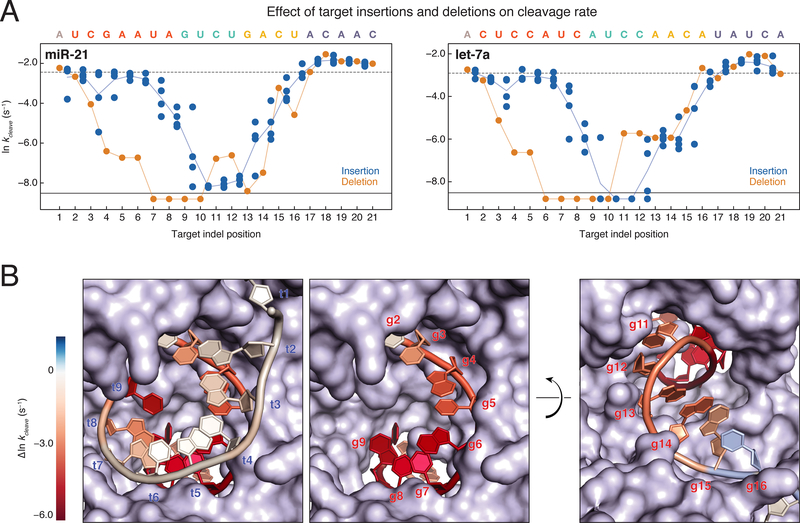
Figure 5. Target Insertions and Deletions Result in Out of Phase Trends for Cleavage Rates.
(A) Cleavage rates for miR-21 (left) and let-7a (right) single insertions (blue dots) and single deletions (orange dots). Indels that correspond to multiple target positions are plotted in all possible target positions. The cleavage rate of the fully complementary target is indicated by the dotted line. Targets for which no cleavage was detected are plotted below the solid black line. Orange line, all single deletions; blue line, mean of the single insertions.
(B) let-7a cleavage rates were mapped onto the RNA components of the AGO2 crystal structure (PDB ID: 4W5O). Target insertions were mapped onto the 9mer RNA target such that the mean of all insertions between t1 and t2 are mapped onto t1. Single deletion cleavage rates were mapped onto the guide strand of the structure. Cleavage rates near the wild-type rate are colored white, while immeasurably slow cleavage rates are colored deep red. The first frame shows both the guide and target strands as they enter the central cleft of the protein, while the second frame shows only the guide strand. The third frame shows the guide strand as it exits the central cleft of the protein.
See also Figure S5.

