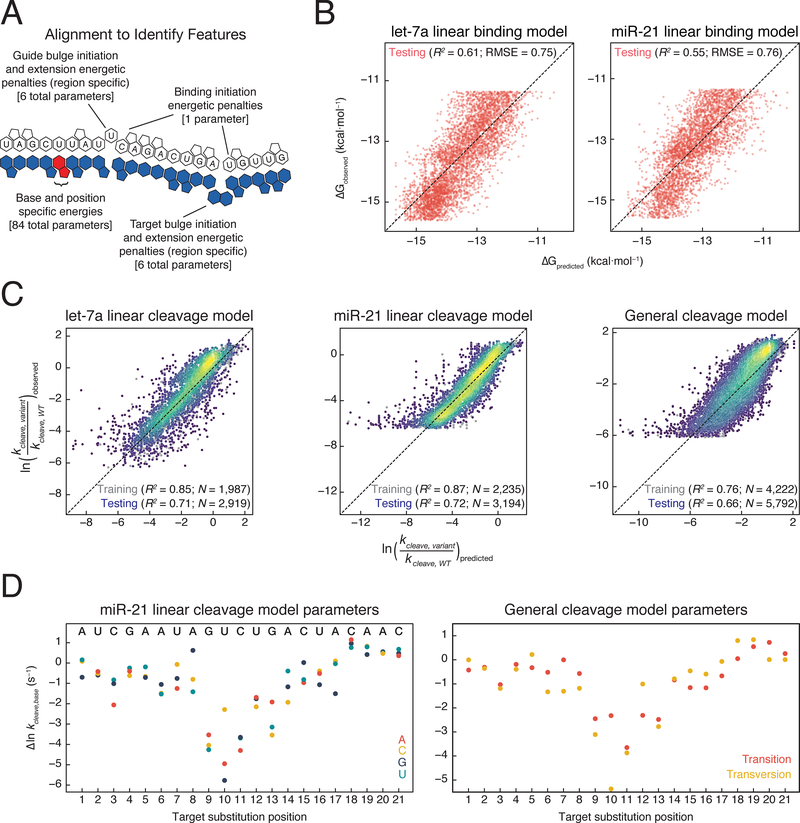
Figure 6. Predictive Models for AGO2 Binding Affinity and Cleavage Kinetics.
(A) Schematic of alignment of guide and target sequences to identify bound orientation.
(B) Comparison of binding affinity predicted by let-7a and miR-21 specific models to observed binding affinities.
(C) Comparison of cleavage rates predicted by let-7a and miR-21 specific models, or by a general cleavage model to observed cleavage rates. The color of the points represents the density of points at that position, with yellow being the densest and purple being the least dense.
(D) Parameters obtained from fitting miR-21 cleavage model or a general cleavage model.
See also Figure S6.

