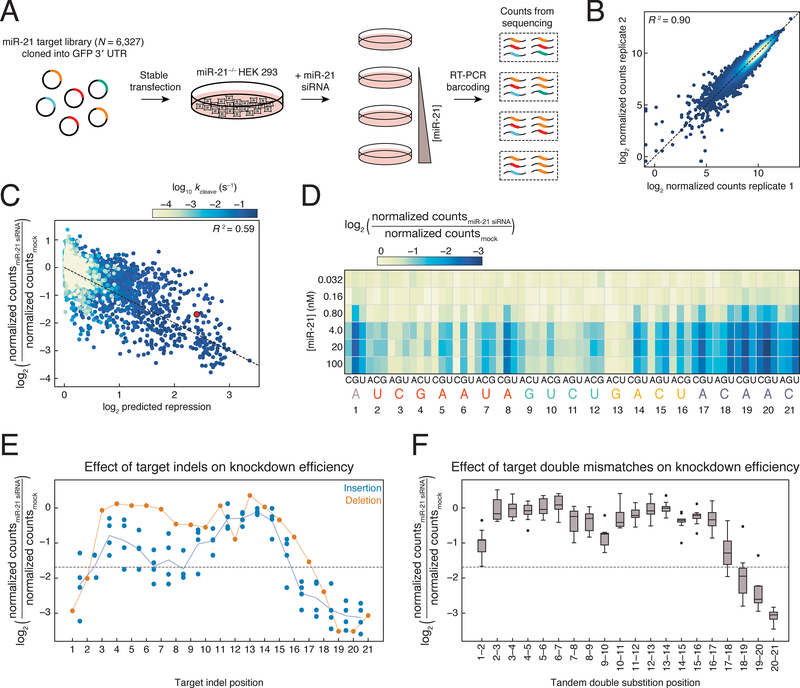
Figure 7. Binding Affinity and Cleavage Rate Affect Knockdown in Cells.
(A) Scheme used to measure change in abundance of miR-21 targets.
(B) Comparison of normalized counts obtained from replicate miR-21 siRNA transfection experiments at the same concentration. Points are colored by density, with yellow being the densest and blue being the least dense.
(C) Biochemical model for predicting siRNA knockdown from measured kon and kcleave, and predicted koff of each target. Sample shown is from the 100 nM miR-21 transfection. Individual targets are colored by RISC-CNS measured cleavage rate. Red dot, perfectly complementary target. Dotted line has slope of −1 and intercept of 0.
(D) Knockdown of targets bearing single mismatches at each miR-21 siRNA concentration transfected.
(E) Knockdown of targets with single insertions (blue dots) or deletions (orange dots) following 100 nM transfection. Indels that correspond to multiple target positions are plotted in all possible target positions. Dotted line, target fully complementary to the siRNA. Orange line, all single deletions; blue line, mean of the single insertions.
(F) siRNA-directed (100 nM) reduction in abundance for all tandem, doubly mismatched targets. Dotted line, target fully complementary to the siRNA.
See also Figure S7.

