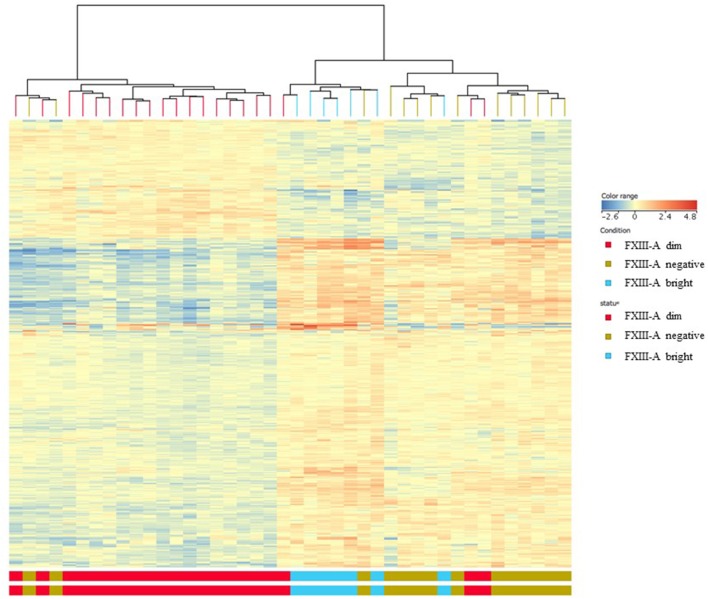
Figure 2.
Gene expression signatures according to FXIII-A protein expression; heat map analysis. With the exception of one to two outliers within the respective groups, heat map analysis exhibited three different patterns of gene expression for each, FXIII-A negative (green color), FXIII-A dim (red color), and FXIII-A bright (blue color) subgroups.

