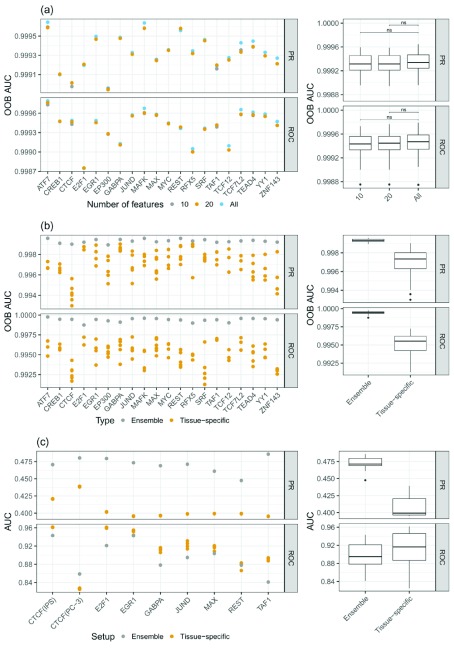
Figure 3.
a) PR-AUC and ROC-AUC for different sets of features: considering all features, the top 10, and the top 20 features. One can see that the difference in model performance between the top 20 and all feature cases is only marginal. b) Comparison of the out of bag (OOB) error between ensemble models and tissue-specific random forest (RF) classifiers. The ensemble models show superior performance compared to the tissue-specific RF classifiers. c) PR-AUC and ROC-AUC computed on unseen test data for ensemble and tissue-specific RF classifiers. Due to the imbalanced nature of the test data, the ROC-AUC values are overly optimistic, as they are biased by the numerous unbound sites. However, the PR-AUC represents a more realistic view on the actual performance of the models. Note that the scale of the y-axes are different for the sub-figures.

