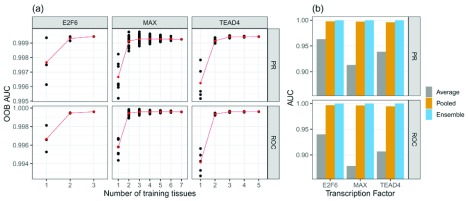
Figure 4. Comparison of tissue number and classifier setups for the three TFs E2F6, MAX, and TEAD4.
a) Model performance as a function of number of tissues used for training. The OOB reduces if more tissues are included in the ensemble learning. Red dots represent the mean classification error across all tissue-specific classifiers. The black points represent individual models. b) Comparison between two ensemble models: averaging (takes the average of all individual RF predictions) and the RF ensemble model. In addition, one RF classifier was trained on pooled data sets comprised of training data for all available tissues for one target TF. The ensemble models perform better than the models based on aggregated data

