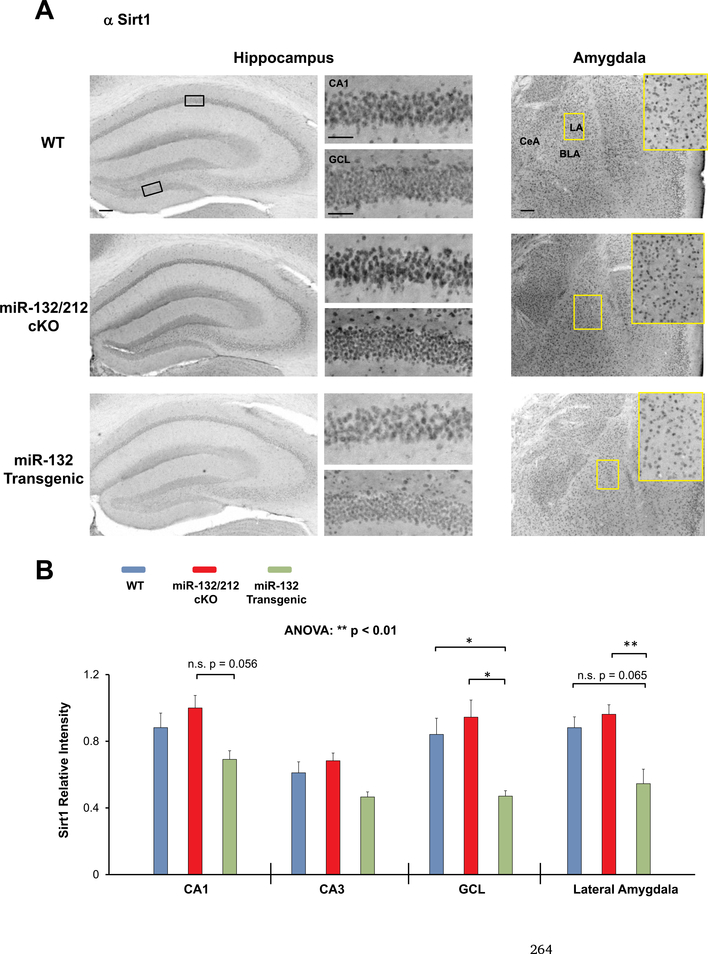
Fig. 5. Profiling Sirt1 expression in miR-132/212 cKO and miR-132 transgenic mice.
(A) Representative immunohistochemical labeling for Sirt1 in the hippocampus and amygdala of WT (blue), miR-132/212 cKO (red), and miR-132 transgenic mice (green). The boxed regions in the lowmagnification images approximate the locations of the regions that are depicted in the high-magnification panels (to the right for the hippocampus, and inset for the amygdala). (B) Quantification of Sirt1 immunolabeling in three hippocampal regions (the CA1, CA3, and GCL) and in the lateral amygdala. Note the increased expression of Sirt1 in the miR-132/212 cKO animals. Scale bar = 50 μm for the low magnification images (i.e., whole hippocampus and amygdala) and 30 μm for high magnification images (i.e., CA1 cell layer and GCL-lower blade). Data were analyzed by two-way ANOVA with Bonferroni post-hoc correction and are presented as the mean ± SEM. *: p < 0.05; **: p < 0.01; n.s.: not significant (p > 0.05). N = 3–5 mice per genotype.

