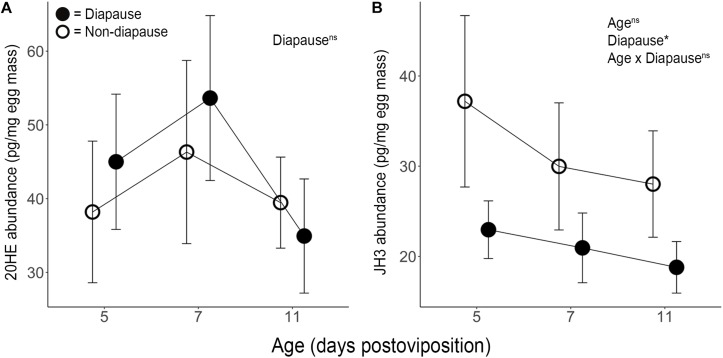
FIGURE 1.
Mean ± SE (A) 20-hydroxyecdysone (n = 5–10) and (B) juvenile hormone III (n = 11–12) abundance per mg of diapause (●) and non-diapause (○) eggs. The results of ANOVA shown in the upper right indicate effects of age, diapause status and their interaction. ∗Indicates p < 0.05 and “ns” indicates p > 0.05.

