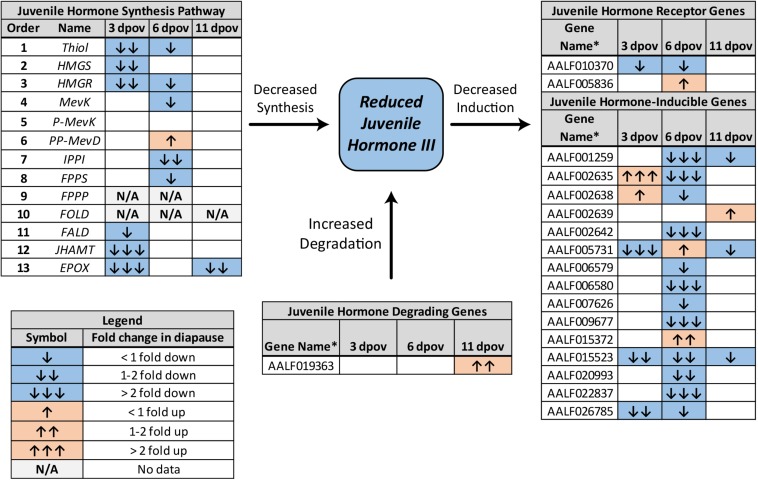
FIGURE 2.
Summary of differential expression of genes involved in JH3 synthesis, degradation, and induction for Ae. albopictus (Poelchau et al., 2013a, b). Significant diapause-induced reductions (blue) or increases (orange) are indicated by shaded cells. The differential magnitude is indicated by arrows as described in the legend in the lower left. ∗Genes without common names are identified by VectorBase ID number.

