Fig. 3.
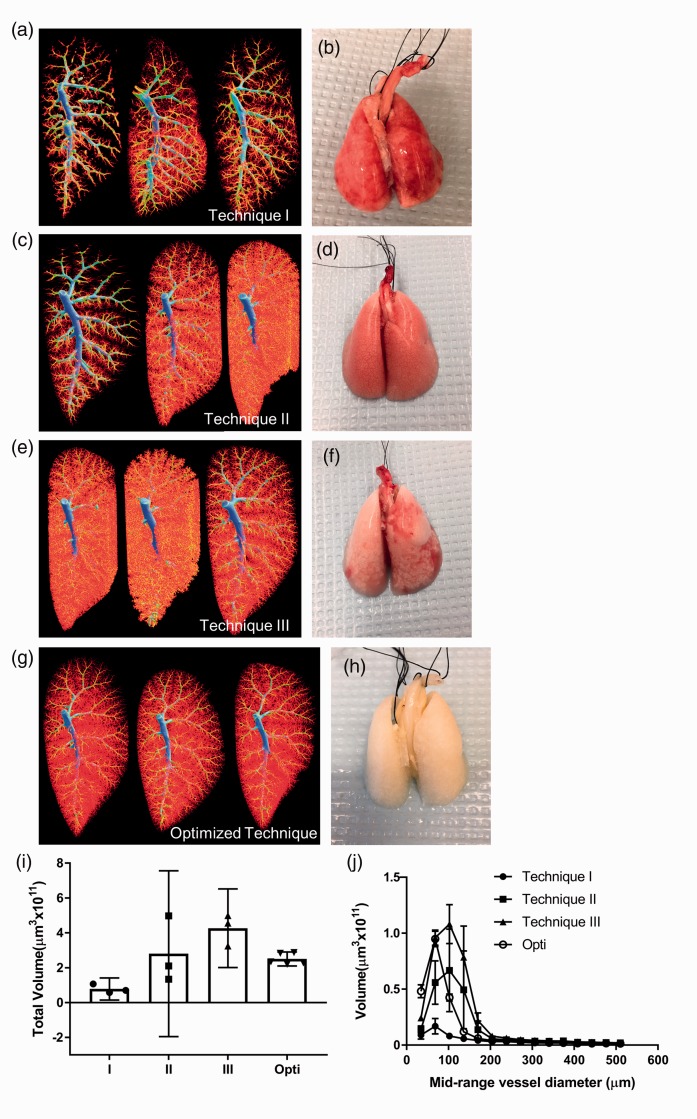
Our optimized perfusion protocol successfully flushes blood from the lungs and produces more consistent micro-CT images compared to alternative perfusion techniques. (a) Micro-CT images produced by technique I (described in the Supplemental file) show sub-optimal filling, unperfused areas of vessels and pulmonary vein filling (n = 3). (b) Representative photo of poorly flushed lungs post-perfusion with technique I (lungs from middle micro-CT image in (a)). (c) Micro-CT images produced by technique II (described in the Supplemental file) show inconsistently filled vascular trees (n = 3). (d) Representative photo of poorly flushed lungs post perfusion with technique II (lungs from first micro-CT image in (c)). (e) Micro-CT images produced by technique III (described in the Supplemental file) show overfilled capillaries and unperfused regions (n = 3). (f) Representative photo of poorly perfused lungs that produced the middle micro-CT image in (e). (g) Uniform micro-CT images (representative) produced by our optimized perfusion technique (opti) (n = 5). (h) Representative photo of well-flushed lungs resulting from our optimized technique (second micro-CT image in (g)). (i) Quantification of left lobe total volume from micro-CT images shows the consistency and efficient perfusion of our optimized technique, data represent mean ± 95% CI. (j) Quantification of left lobe volume broken down by mid-range vessel diameter shows the greatest source of variability between perfusion techniques to be in vessels < 200 µm in diameter, data represent mean ± SEM.

