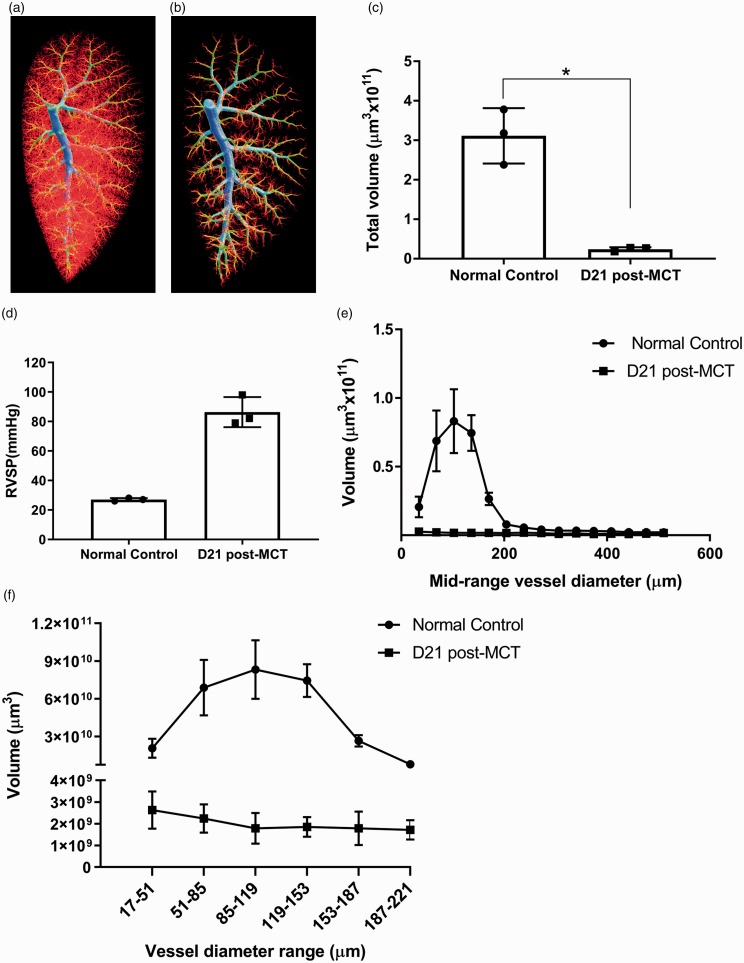
Fig. 4.
SD rats with MCT-induced PAH have significantly lower total vascular volume in the left lobes of their lungs in comparison to normal age-matched controls. (a) Representative 3D vascular tree of normal SD control rat (in vivo RVSP = 27 mmHg). (b) Representative 3D vascular tree of PAH SD rat 21 days post-MCT injection (in vivo RVSP = 98 mmHg). (c) Quantification of total vascular volume in left lobes scanned with micro-CT demonstrates a significant reduction in MCT rats as determined by Welch's unequal variances t-test, *p value < 0.02. (d) In vivo RVSP measured in rats before perfusion that was used as a reference for the pressures maintained during the perfusion process. (e) Quantification of vascular volume broken down by mid-range vessel diameter demonstrates the greatest loss of volume in MCT-induced PAH to be in vessels < 200 µm in diameter. (f) Quantification of vascular volume broken down by vessel diameter range below 250 µm highlights the difference in microvasculature between normal control and MCT-induced PAH rats, please note split y-axis. All data represent mean ± SD, n = 3 per group.

