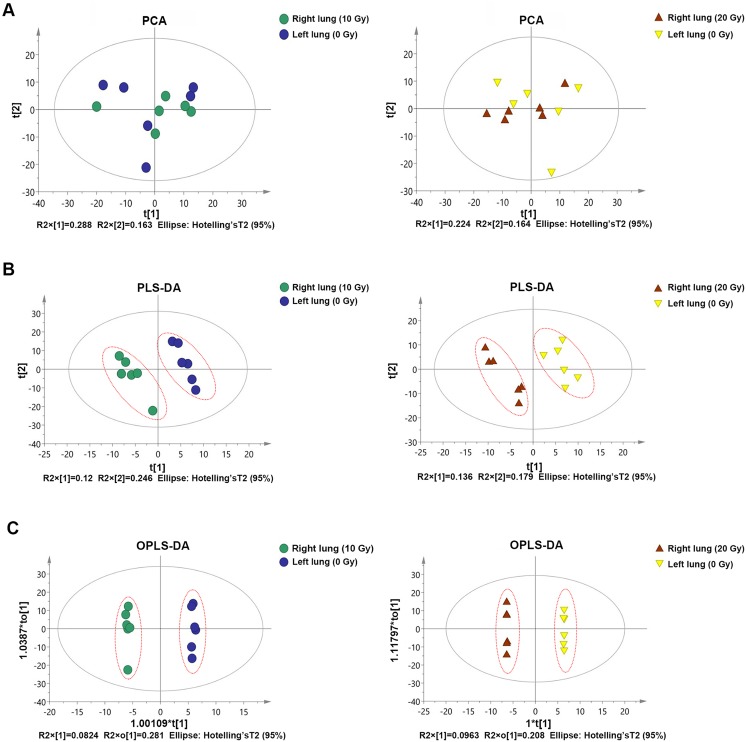
Figure 3.
The score maps of various analysis patterns. A, The degree of separation between the 2 groups of samples in the PCA score maps. B, The degree of separation between the 2 groups of samples in the PLS-DA score maps. C, The degree of separation between the 2 groups of samples in the OPLS-DA score maps. OPLS-DA indicates orthogonal partial least squares discrimination analysis; PCA, principal component analysis; PLS-DA, partial least squares discriminant analysis.

