Fig. 7.

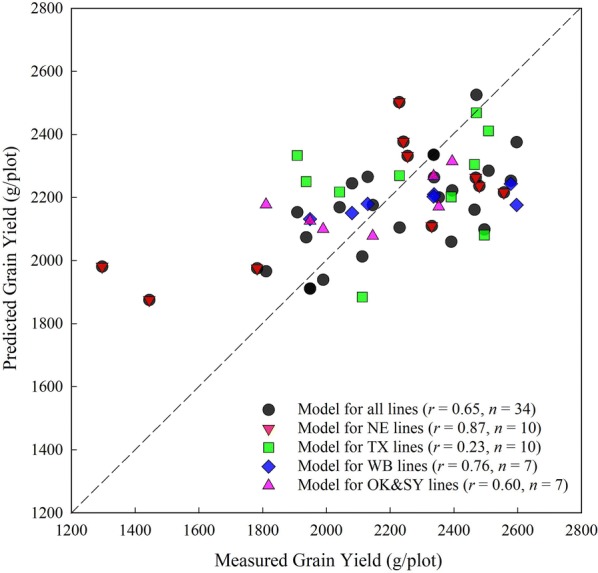
Relationship between measured and predicted grain yield of an example training–testing set for each group of lines. Dashed line is the 1:1 line. r is correlation coefficient; n is testing sample size

Relationship between measured and predicted grain yield of an example training–testing set for each group of lines. Dashed line is the 1:1 line. r is correlation coefficient; n is testing sample size