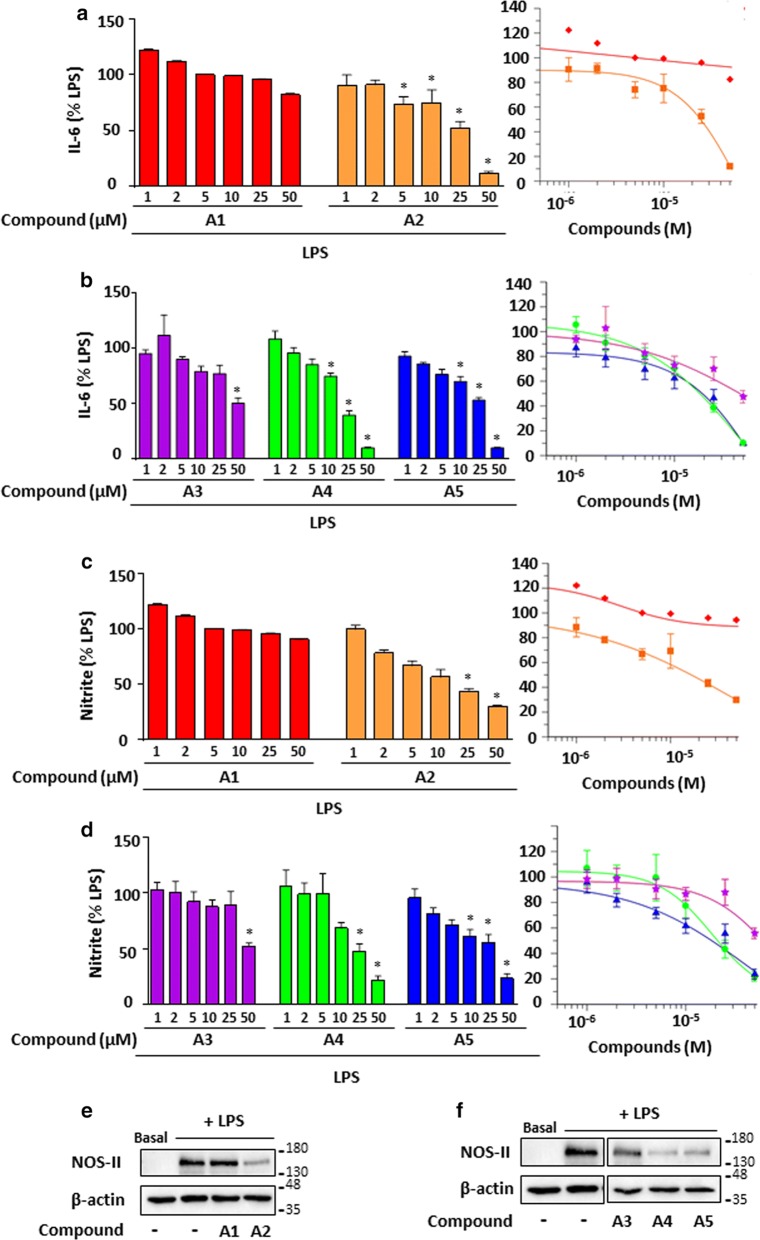
Fig. 3.
Effects of the gem-difluorobisarylic derivatives IL-6 and nitrite, and NOS-II expression. BMDM were treated with 6 increasing concentrations of all compounds prior to the addition of 10 ng/mL LPS for 24 h. IL-6 and NO production was measured and expressed as percentage of LPS for a, c compounds A1 and A2, and b, d, compounds A3, A4 and A5, respectively. Corresponding IC50 fitting curves are shown. e, f NOS-II and β-actin expression in basal and LPS-treated BMDMs with 50 µM of all compounds. Results are obtained from the same blot. Protein bands for basal or LPS-treated in macrophages in the absence of inhibitors, as shown in e and f, are identical for illustration purpose. β-actin was used as loading control. Data are represented as mean ± SEM (n = 4), *p < 0.05 versus LPS (One-way Anova followed by the Dunnett’s test)

