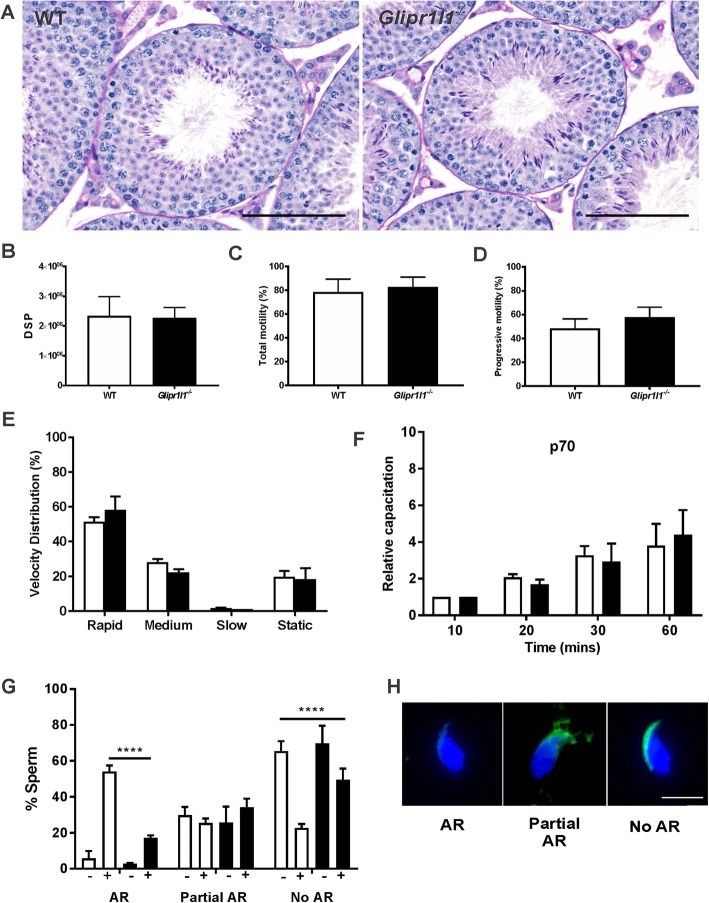
Fig. 8.
Fertility assessment of Glipr1l1−/− mice. a Testicular morphology was assessed by periodic acid-Schiff (PAS) staining of the testis sections from WT and Glipr1l1−/− mice as described in the “Methods” section. This experiment was replicated in a minimum of three mice per genotype and representative PAS staining is shown. Data are expressed as the mean ± S.D. Scale bar = 50 μm. b Daily sperm production (DSP) within testis from WT and Glipr1l1−/− mice. This experiment was replicated in a minimum of five mice per genotype, and the data are expressed as the mean ± S.D. Genotypes are shown on the X-axis, and data were shown as mean ± S.D. c–e Computer-assisted sperm analysis demonstrates no significant difference in the motility, progressively motility, or other sperm velocity parameters between WT and Glipr1l1−/− mice. This experiment was replicated in a minimum of five mice per genotype, and the data are expressed as the mean ± S.D. f As a marker of capacitation, the level of global tyrosine phosphorylation in the whole sperm population was measured. The X-axis depicts the length of time sperm were exposed to capacitation permissive media, as described in the “Methods” section. The relative intensity of the 70-kDa (p70) band was measured. This experiment was replicated in a minimum of six mice per genotype and the data are expressed as the mean ± S.D. g, h Assessment of the ability of Glipr1l1−/− sperm to undergo the acrosome reaction. AR indicates acrosome-reacted spermatozoa in which the entire acrosomal contents had been released from the sperm head (i.e., no PNA labeling). Partial AR indicates spermatozoa in which the acrosomal contents were incompletely shed from the sperm head (i.e., partial PNA labeling). No AR indicates spermatozoa in which the acrosomal contents are retained (i.e., complete PNA labeling). + or – indicates exposure to progesterone for the final 15 min of capacitation. This experiment was replicated in a minimum of four mice per genotype with a minimum of 200 spermatozoa being examined in each replicate. Data are expressed as the mean ± S.D. *P < 0.05, **P < 0.01, ***P < 0.001. Individual data points for each replicate are provided in Additional file 6: Raw data

