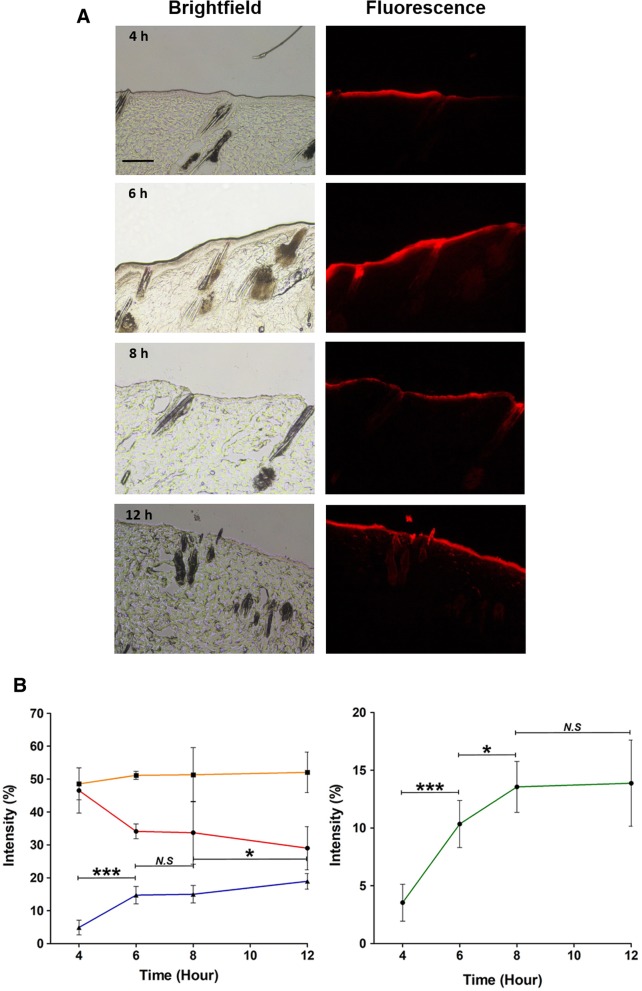
Fig. 8.
a Fluorescence microscopic images of histological section of rat skin at 4, 6, 8 and 12 h after topical application of Rho B encapsulated HA-PLGA NPs. Scale bar indicates 100 μm. b Quantitative analysis of fluorescence intensity at each skin layer: stratum corneum (●), epidermis (■), dermis and follicle cells (▲) and only follicle cells (♦). (mean ± SD, n = 5, ***p < 0.001, t-test)

