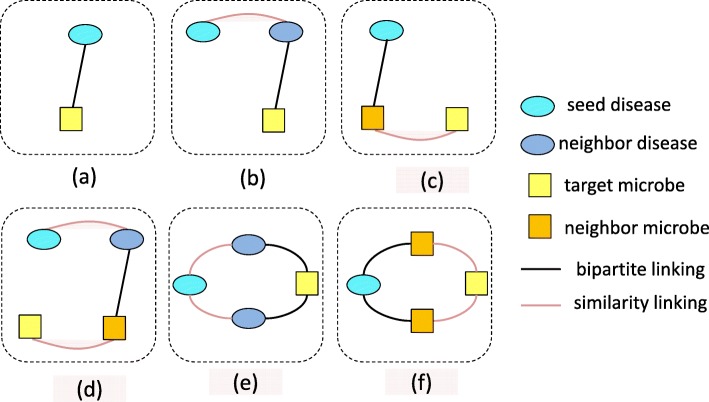
Fig. 6.
Examples of weighted meta-graphs used for microbe-disease association prediction. Red line represents the similarity linking between diseases that weights similarity degree; Black line is bipartite linking that denotes whether a disease is associated with a microbe or not, i.e., if a disease is confirmed to be related to a microbe, the weight value of corresponding edge equals to 1, otherwise 0. The numbers of the given nodes directly connected to the bipartite edge are 2, 1, 1, 0, 1, 1 from (a) to (f), respectively

