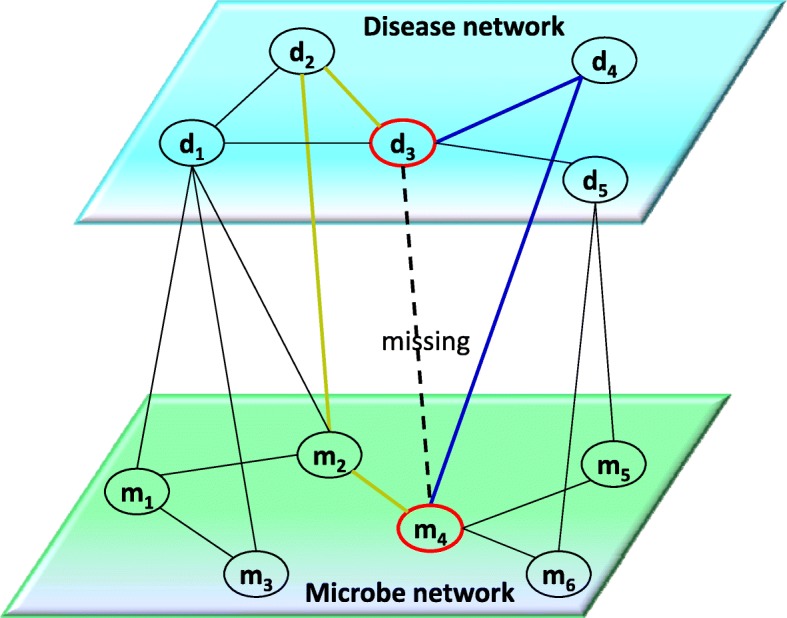
Fig. 7.

The heterogeneous information network. Two types of weighted meta-graphs (i.e. Fig. 6b,d) can be utilized to obtain the probability score of interaction between new disease node d3 and candidate microbe node m4, such as weighted meta-graphs consisting of d3,d4,m4 and d3,d2,m2,m4, respectively. d3 represents unlabeled disease; d1,d2,d4 and d5 denote labeled disease; m1,m2,m3,m4,m5 and m6 represent labeled microbes; Solid lines and dotted line in the bipartite network means known and unknown bipartite linkings, respectively
