
Figure 1.
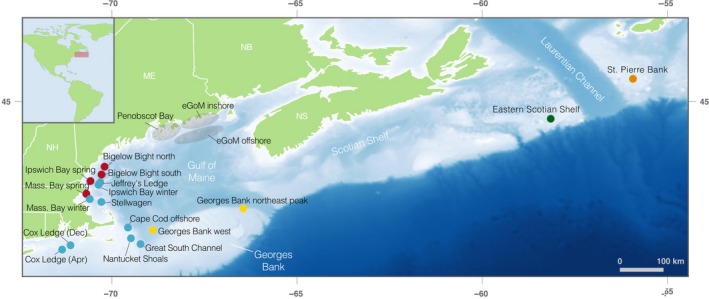
A map of the sampling locations used in the study. Locations of spawning aggregations sampled are shown by the colored points. St. Pierre Bank and the eastern Scotian Shelf are Canadian sampling locations; all other samples come from U.S. or transboundary waters. The colors represent our a priori understanding and expectations of the population structure: red and blue = northern spring coastal complex and southern complex, respectively, of Kovach et al. (2010); yellow = Georges Bank; green = eastern Scotian Shelf; orange = St. Pierre Bank. The ranges within which the nonspawning fish from the eGoM were caught are shown by the gray circles